Biomedical Engineering Reference
In-Depth Information
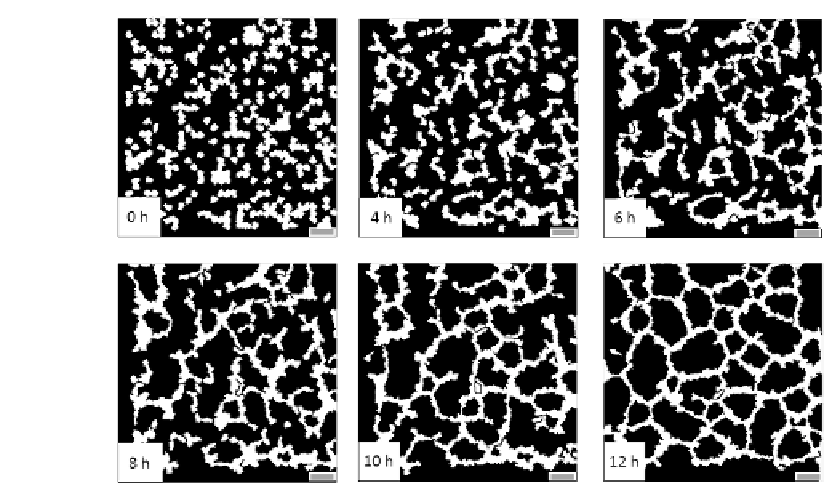
FIGURE 7.3: Tumor-derived capillary-like network formation. The simula-
tion initiates with 150 quiescent TECs over , a square lattice of size L
= 1
mm. Representative images show a time-sequence of the tubule organization.
The scale bar is 100 m long.
We randomly distribute n = 150 TECs in , reproducing a typical exper-
imental cell density [133]. Each individual has initially an unpolarized mor-
phology with a diameter of 40 m (20 lattice sites), while its nucleus is a cen-
tral and round cluster with a radius of 6 m (3 sites). These measures agree
with the most usual geometries observed in in vitro TEC cultures [133, 135].
A single cell is therefore a moving subdomain, that extends over an area of
nearly 320 sites ( 1280 m
2
). Such a spatial resolution allows to have a good
approximation in the resolution of the spatiotemporal intracellular dynamics
without slowing down the computational speed too much.
Cells do not undergo mitosis or death during the entire simulations. In
this way, consistently with the experimental observations given in the previous
section and with other similar approaches [259, 260, 261], the density of the
culture is conserved during the overall process.
The biological variables are initiated at their physiological levels. In par-
ticular, as in the simulations of Chapter 6, there are no activated second
messengers within the cells, and the intracellular basal calcium concentration,
c
0
, is assumed to be spatially homogeneous. In the extracellular domain, the
initial level of Ca
2+
is again set equal to c
ext;0
, while there are no VEGF
molecules. The model parameters are also the same as in the case of the sin-
gle cell, see Table C.6 in the Appendix. Moreover, J
0
= 5 represents the low


Search WWH ::

Custom Search