Biomedical Engineering Reference
In-Depth Information
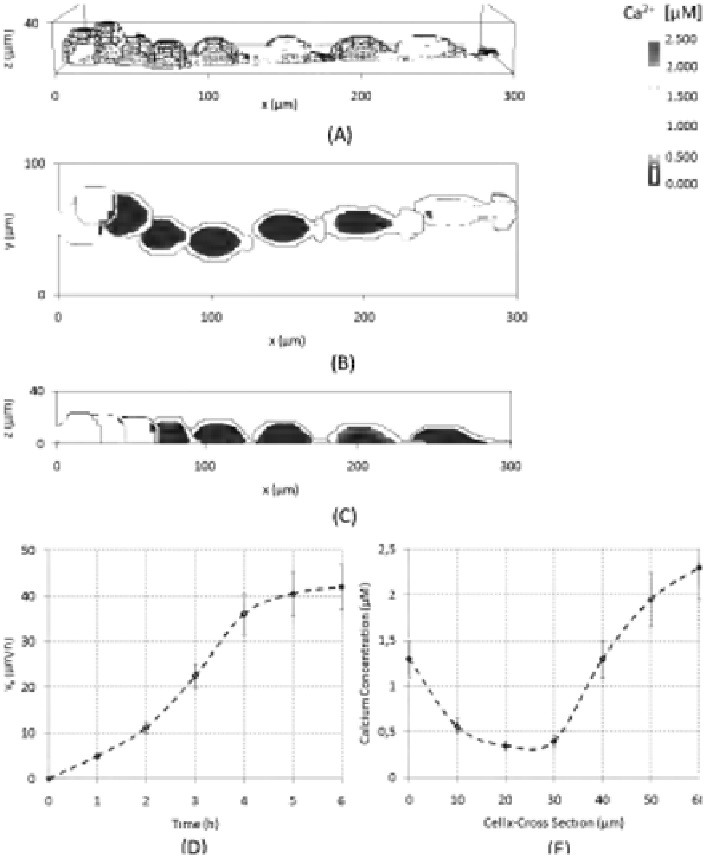
FIGURE 6.14: (See color insert.) VEGF source extended to the whole right
lower edge of the migration chamber. (A) Three-dimensional view of cell posi-
tion (red line represents the VEGF source), (B) and (C) contour plots showing
intracellular calcium concentration during cell motion in, respectively, z = 1
m plane and y = 50 m plane. For (A), (B), and (C) representative images
taken, as usually, at 45 min intervals until t = 6. (D) Evolution in time of cell
directional velocity v
x
. (E) Ca
2+
concentration profiles at the end of migra-
tion, t = 6 h, along cell x-cross-section of the z = 1 m plane from the trailing
edge to the leading edge. Mean over 10 simulations; the error bars represent
standard deviation.


Search WWH ::

Custom Search