Biomedical Engineering Reference
In-Depth Information
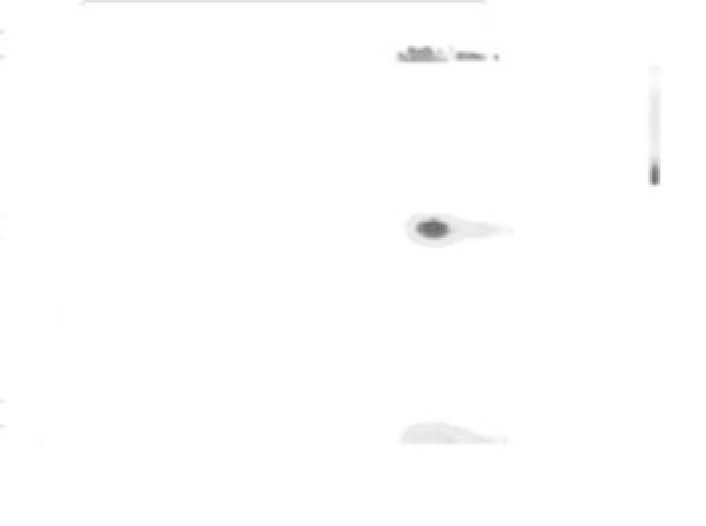
FIGURE 6.11: (See color insert.) Cell migration with interference in the
buffering process. (A) Three-dimensional view of cell position at t = 5 h in
the case of no buffers with the relative intracellular calcium profiles in (B) z
= 1 m plane and (C) y = 50 m plane. In (A) red dot represents the VEGF
source.
ically, we locally vary the factor K
buff
:
K
off
K
off
+ K
on
b
T
d(x)
d
0
;
K
buff
(x) =
(6.15)
where d(x) and d
0
are the measures of the net Euclidean distance from the
PM of, respectively, site x and of the cell center of mass x
CM
. With respect
to the standard case, also the proposed buffer clusterization does not strongly
change the final spatial profile of calcium, but causes an increment of the
maximal peak of responses at the tip of the motility structures (whose value
is obviously the same as in the absence of buffers) and a decrement in the
concentration of the ion in the more internal regions (i.e., the elevate presence
of buffers almost blocks the diffusion of calcium, so that the zone with a basal
level of the ion is bigger); see Figure 6.12. Indeed, we have a steeper gradient of
the intracellular Ca
2+
level along the polarized axes of the cell, as illustrated
in detail in Figure 6.12(H). However, the total final calcium concentration
remains elevate (c
(t = 6 h) 3.2), as well as the motile capability of the cell,


Search WWH ::

Custom Search