Biomedical Engineering Reference
In-Depth Information
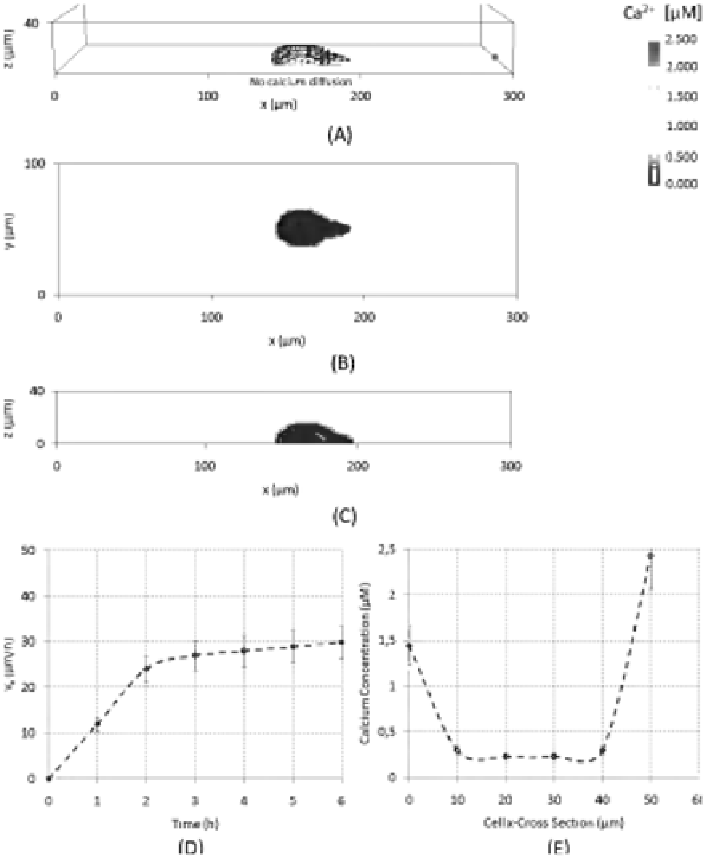
FIGURE 6.10: (See color insert.) Cell migration with the exclusion of cal-
cium diffusion (D
c
= 0). (A) Three-dimensional view of cell position at t =
6 h, red dot represents the VEGF source. Contour plots showing the final in-
tracellular calcium concentrations in (B) z = 1 m plane and (C) y = 50 m
plane. Calcium concentration has been pseudocolor-scaled so that the max-
imum value is red. (D) Evolution in time of cell directional velocity v
x
. (E)
Ca
2+
concentration profiles at the end of migration, t = 6 h, along cell x-
cross-section of the z = 1 m plane from the trailing edge to the leading edge
of the polarized cell. The cell reaches more quickly the maximal directional
velocity. which has a lower maximal peak. Mean over 10 simulations; the error
bars represent standard deviation.


Search WWH ::

Custom Search