Biomedical Engineering Reference
In-Depth Information
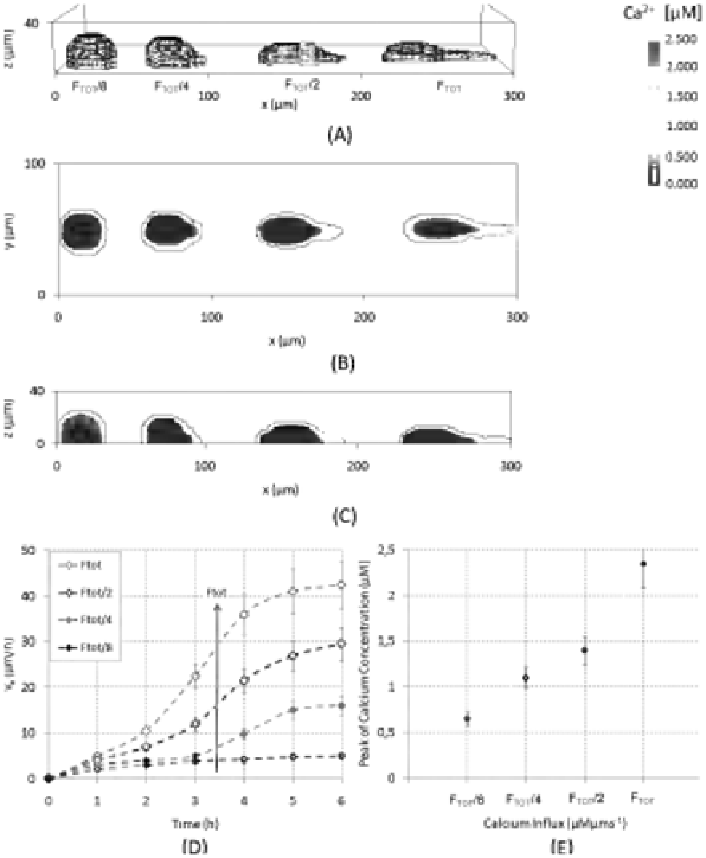
FIGURE 6.8: (See color insert.) Partial inhibition of overall VEGF-induced
calcium influx F
TOT
= F
AA
+ F
NO
. (A) Three-dimensional view of cell po-
sition at t = 6 h for each F
TOT
-decrement. Red dot represents the VEGF
source. Contour plots showing the final intracellular calcium profile in (B) z
= 1 m plane and (C) y = 50 m plane. Calcium concentration has been
pseudocolor-scaled so that the maximum value is red. (D) Evolution in time
of cell directional velocity v
x
. The complete inhibition of calcium responses
(F
TOT
= 0) dramatically stops cell directional motility (x
CM
(t = 6 h) = 20
m and v
x
3:3 m/h). (E) Maximal Ca
2+
concentration at t = 6 h. The
error bars show standard deviation over 10 simulations.


Search WWH ::

Custom Search