Biomedical Engineering Reference
In-Depth Information
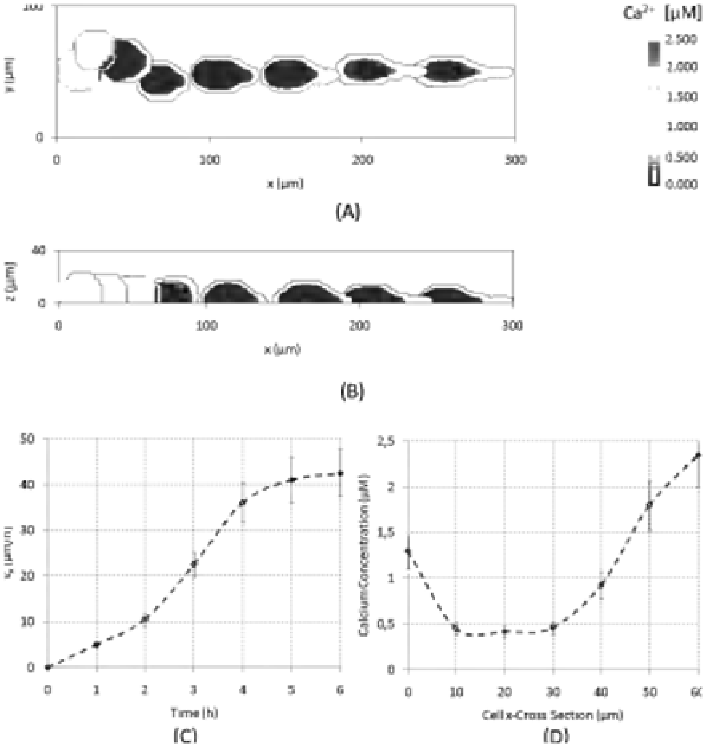
FIGURE 6.7: (See color insert.) VEGF-induced calcium events. Contour
plots showing intracellular calcium concentration during cell motion in (A) z
= 1 m plane and (B) y = 50 m plane. Representative images taken at 45
min intervals until t = 6 h as in Figure 6.6(A). (C) Cell directional velocity
v
x
(i.e., toward the chemotactic source). (D) Ca
2+
concentration profile at
the end of migration, t = 6 h, along cell x-cross-section of z = 1 m plane
from the trailing edge to the leading edge of the polarized cell. Higher Ca
2+
accumulation (> 2 M) is observed in the thin pseudopodium. Negligible
calcium events are seen in the central-nuclear area (< 0.5 M). Mean over 10
simulations; the error bars represent standard deviation.
artifact of staking the nuclear compartment to the underlying lattice with a
finite rigidity, which is suciently high to results in a slow movement of the
nucleus but low enough to avoid the total block of its locomotion.


Search WWH ::

Custom Search