Biomedical Engineering Reference
In-Depth Information
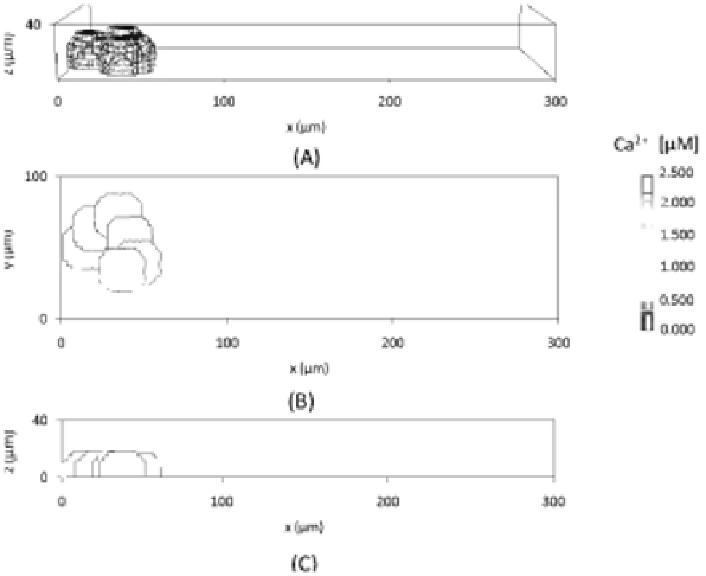
FIGURE 6.5: (See color insert.) Endothelial cell phenomenology and rel-
ative calcium events in control conditions (without external stimuli) at 30
min intervals until t = 3 h. (A) Three-dimensional view of cell migration.
Contour plot showing cell position and intracellular calcium concentration in
(B) z = 1 m plane and (C) y = 50 m plane. Calcium concentration has
been pseudocolor-scaled so that the maximum value is red. The simulated
cell almost maintains its initial hemispheric morphology and undergoes an
essentially random motion. No calcium signals are observed.
itself. We recall that in any CPM model the simulated objects experience an
implicit drag force from the lattice, and thus they have Aristotelian dynam-
ics rather than a Newtonian dynamics (refer to [20, 254] for more detailed
comments). Pulled by the leading front, the overall cytosolic region, whose
elasticity and mobility increase due to the concomitantly calcium accumula-
tion, then deforms and moves forward, while pulling onto the nucleus with the
same force. The nucleus (which, as a CPM object, also follows Aristotelian
dynamics) is instead basically stuck to the underlying lattice, as a consequence
of its rigidity: therefore it moves with a lower velocity than the surrounding
cytosol and lags behind, creating the characteristic polarized morphology of
the TEC.
These mechanisms are a simplified picture of the biological processes un-


Search WWH ::

Custom Search