Biomedical Engineering Reference
In-Depth Information
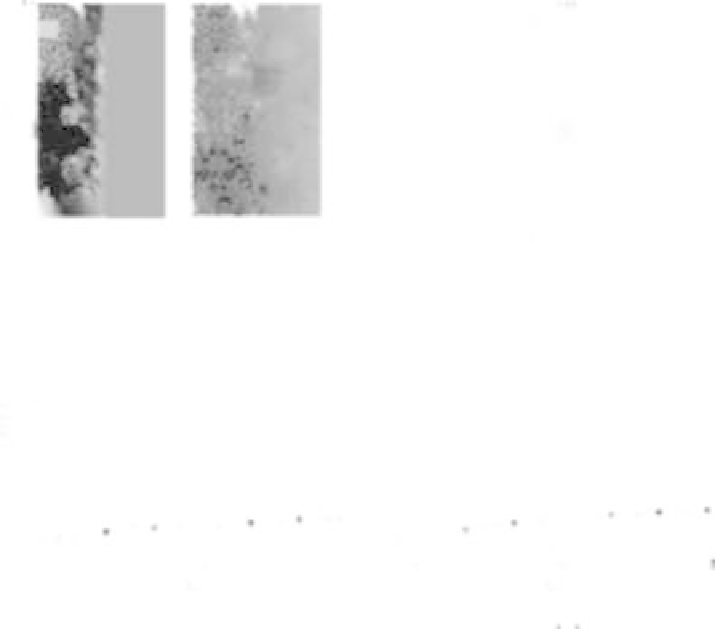
FIGURE 5.3: Healing process of the unstimulated ARO population. The
cellular mass shows a negligible invasive capability within the observation
period. (A) Final pattern configuration (i.e., at t = 12 h) for both simulation
(left panel) and experiment (right panel). (B) Time evolution of D. (C) Polar
plot of the net displacements of 20 representative cell randomly selected within
the population. (D) Time evolution of the modulus of their velocity.
ulations in which we will differentiate the cell culture are instead performed
in a single realization. This choice was made after observing small SDs over
multiple simulations. In particular, for each subgroup, the instantaneous ve-
locity (calculated for each cell as defined in Equation (1.11), where obviously
the center of mass is established as
X
1
a
volume
x
CM
(t) =
x;
(t)
x
2
since we apply the new compartmentalization approach) and the linearity are
averaged with SD over 30 individuals, while in the polar charts, we represent
the final displacements of 20 representative cells.


Search WWH ::

Custom Search