Geology Reference
In-Depth Information
to the recorder. The shock is created by a falling weight (for shallow
investigations) or by explosives (allowing a better vertical penetration).
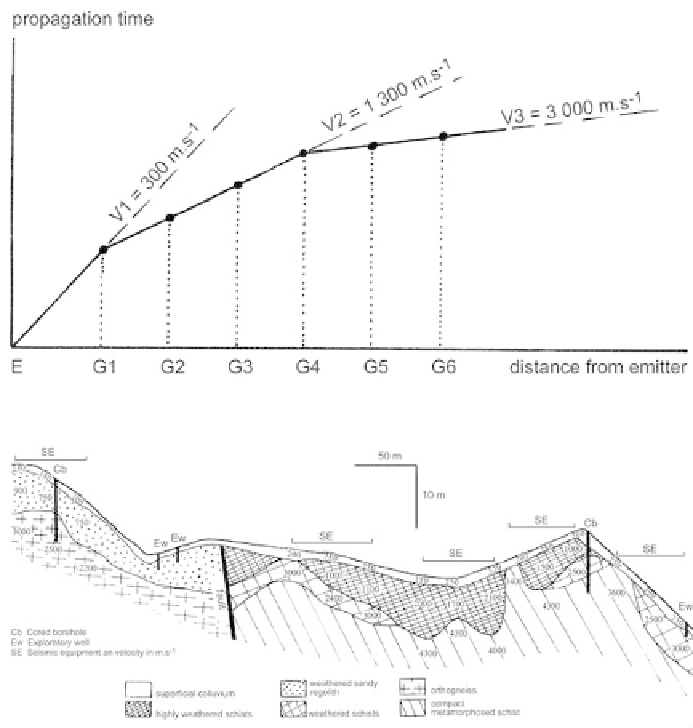
Starting at the time of the shock, the time for the waves to propagate to each
geophone is measured, allowing the creation of a T-X graph of the arrival
times as a function of distance from the source (Figure 57, Figure 58). This
curve can then be used to calculate the apparent velocities, then the true
velocities and the thicknesses of various beds. Generally, two shock waves
are used, one direct, E and one inverse, E', in order to determine whether
the contacts between layers are horizontal or inclined, and in the latter case,
to determine their slope.
Figure
57
T-X graph for a seismic setup.
Figure
58
Interpretation of a seismic study along a road project in Upper Corsica.
Search WWH ::

Custom Search