Geology Reference
In-Depth Information
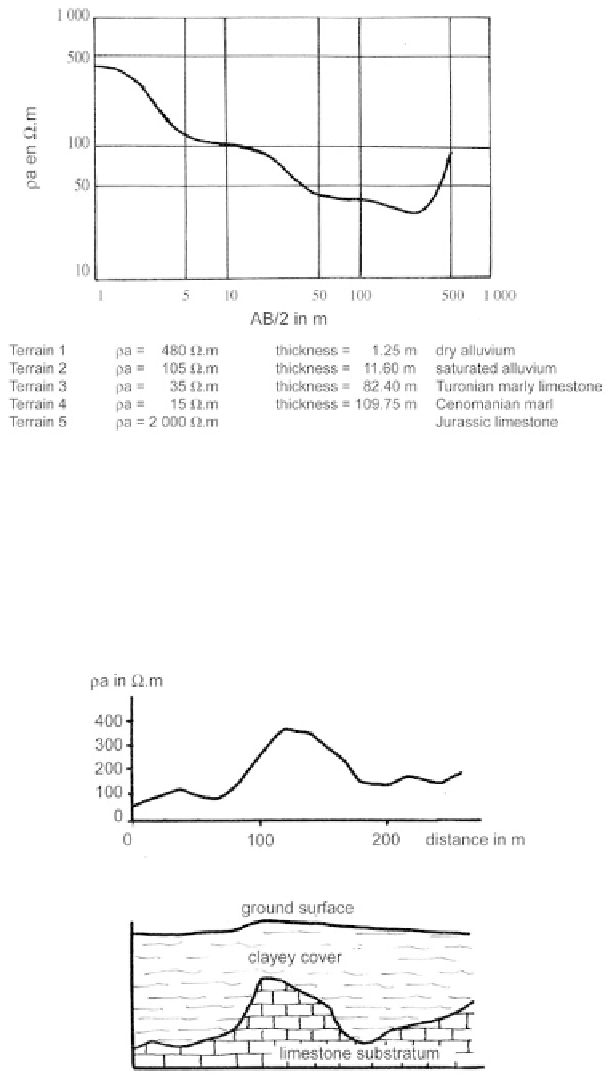
Figure
53
Electric survey curve and its interpretation. Lower Paillon valley (Alpes-Maritimes,
France).
The resistivity profi le is created by moving a constant A-MN-B setup
over a surface or along the length of a set line. The resistivity variations in
the bedrock can thus be measured at a roughly constant depth, which, often
combined with electric surveys, allows for a more detailed understanding
of the homogeneity or heterogeneity of the bedrock, its eventual lateral
variations in facies, or the presence of a fault (Figure 54).
Figur
e
54
Resistivity profi le and its interpretation.
Search WWH ::

Custom Search