Geography Reference
In-Depth Information
0
50
100 km
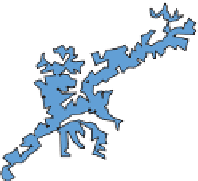
Figure 5.8
Areas in Switzerland with elevation values greater than 2000 m.
that which has the largest score (and thus the highest rank). All that is needed to
implement such a system are simple overlay tools and such an approach can readily
be applied using vector or raster data (Malczewski, 1999), although most MCDA
applications are conducted in the raster environment (see Section 10.2 for a related
discussion).
Case study
5.4
h is case study makes use of zones (polygons) representing areas in Switzerland with
(1) elevation above a threshold value and (2) predicted precipitation amount above a
threshold value. Applications of this kind are common in GIS contexts and the results
of the analysis could easily be combined with data on other properties such as pro-
tected areas or administrative zones. h e data on which this analysis is based are
described in Section 8.7. Figure 5.8 shows areas with elevations of greater than 2000 m
while Figure 5.9 shows areas with a predicted (daily) precipitation amount of greater
than 250 1/10 mm (i.e. 250 tenths of a millimetre). In both cases, the vector features
were generated from raster grids using the ArcGIS™ sot ware and the edges of the
polygon outputs were generalized (smoothed). h e aim was to i nd the common areas
and for this purpose the intersect overlay operator was used. h e i nal result (areas
that fuli l both criteria) is shown in Figure 5.10.


Search WWH ::

Custom Search