Geography Reference
In-Depth Information
Valu
e
High : 45
Low : 28
45
44
44
43
42
44
38
42
43
42
34
35
41
42
42
39
38
32
34
35
38
42
41
39
39
41
37
38
39
42
41
39
32
41
35
31
39
38
37
41
29
29
28
33
41
44
43
42
34
36
37
39
41
37
39
41
35
37
36
36
39
41
36
42
A
B
Moran's
I
:
Rook's case: 0.505
Queen's case: 0.400
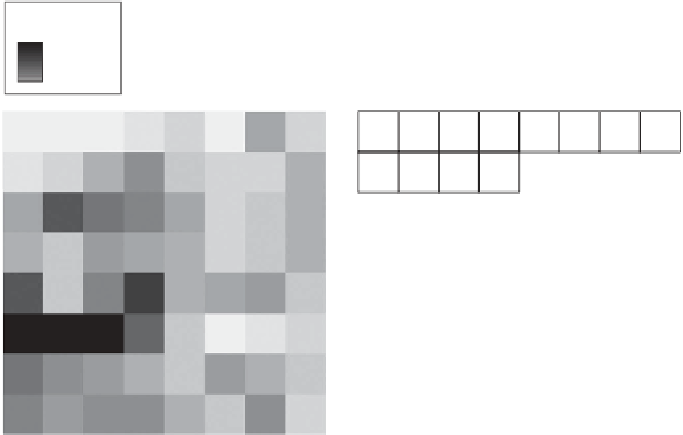
Figure 4.10
Example raster using (A) grey scales and (B) numerical values:
spatial autocorrelation for queen's case and rook's case contiguity.
sample size suggests, since the observations are not independent of one another. As
noted previously, it is important to remember that we must be wary of such problems
when applying standard statistical procedures (e.g. signii cance tests) in the analysis of
spatial data (see Rogerson (2006) for a discussion about this topic).
h ere is a variety of other methods for measuring the degree of spatial autocorrela-
tion. h e purpose of this chapter is only to introduce topics and the analysis of spatial
autocorrelation is explored further in Chapter 8.
The ecological fallacy and the modifi able areal
unit problem
4.9
It is ot en necessary to work with spatially aggregated data, for example census zones
or cells in remotely sensed images. Such zones are unlikely to be internally homoge-
neous. For example, a cell in a remotely sensed image has only one value, but in the
real world there may be several features in the area covered by the cell. In words, the
variation within the cell (or other area) is lost if the area is larger than the individual
features it contains. h is section explores two sets of concepts that relate to such issues.
h ese are the ecological fallacy and the modii able areal unit problem.
h e ecological fallacy refers to the problem of making inferences about individuals
from aggregate data. For example, not all people in one census zone are likely to share
the same characteristics. h e majority of people in a census zone may be wealthy,


Search WWH ::

Custom Search