Geography Reference
In-Depth Information
80
z
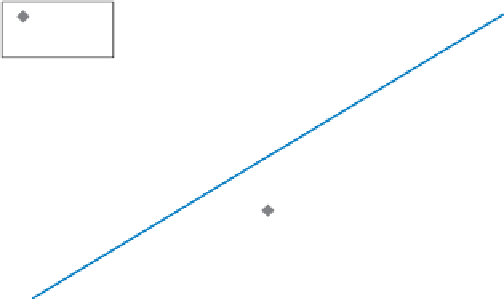
= 8.8711 + 0.7514
y
r
2
= 0.7325
70
z
Linear (
z
)
60
50
40
30
20
10
0
0
10
20
30
40
50
60
70
80
y
Figure 3.4
Scatter plot. Elevation (
y
) in metres (m) against
snowfall (
z
) in centimetres (cm) with line of best fi t.
we replace
b
0
and
b
1
with the values obtained for these previously and replace
y
i
(an elevation value in this case) with 43. h is leads to:
ˆ
i
z
=
8.87190
+
(0.75142
¥
43)
=
41.18296 cm
For an elevation value of 43, therefore, the predicted value of snowfall (to three
decimal places) is 41.183. h is can be coni rmed by looking at Figure 3.4 and drawing
a line from the point corresponding to approximately 43 on the
y
(elevation) axis
upwards to meet the line of best i t and then drawing a line from the point where
the added line and the line of best i t meet across to the
z
(snowfall) axis. If the lines
are accurately drawn, then a value of approximately 41 can be identii ed on the
z
(snowfall) axis.
h e goodness of i t of a line of best i t can obtained by measuring the residuals, i.e.
the dif erence between observed values and predicted values. As an example, Table 3.1
includes a
y
(elevation) value of 11 paired with a
z
(snowfall) value of 22. Using the
approach outlined, the predicted value of snowfall for an elevation value of 11 is given by:
ˆ
i
z
=
8.87190
+
(0.75142
¥
11)
=
17.13752 cm
In this case the observed value is 22, and the predicted value to three decimal places
is 17.138 so there is a dif erence (residual) of -4.862. In words, the regression model


Search WWH ::

Custom Search