Geography Reference
In-Depth Information
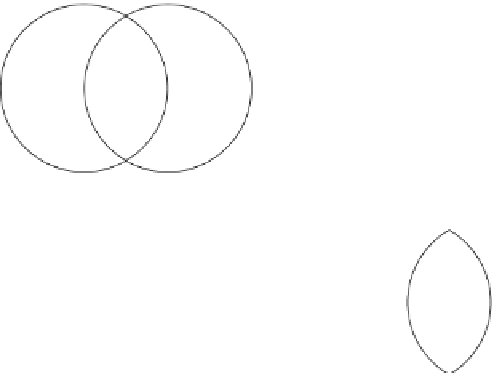
A
B
A
B
A AND B
A OR B
A
B
A
B
A XOR B
A NOT B
Figure 2.9
Boolean logic.
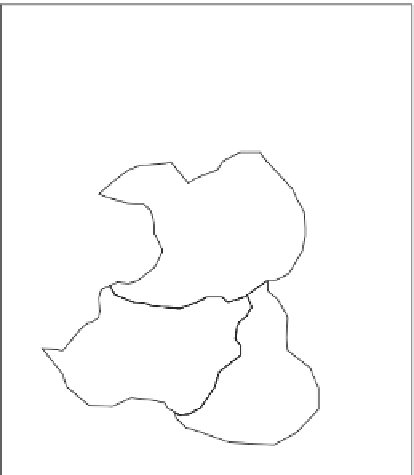
ID Population
1
52
2
111
3
43
4
123
5 215
6 26
7 139
8 75
9 45
10 73
11 432
12 321
13 121
14 175
15
64
16 32
17 234
18 107
Selection for query:
Population < 100
17
16
11
18
15
7
6
9
2
5
4
1
10
3
12
8
14
13
Labels are ID numbers
Figure 2.10
Selected polygons and corresponding table entries.
a layer may be selected that have more than a specii c number of people above a
particular age, but less than a certain percentage (%) who have long-term illnesses.
Such an argument would be structured like this: No.People75plus > 2500 AND
LongTermIll% < 10. Figure 2.9 shows Venn diagrams (used to display possible combi-
nations between groups) illustrating the outcome of the application of Boolean logic


Search WWH ::

Custom Search