Geography Reference
In-Depth Information
Precipitation (mm)
29-50
51-100
101-145
Inland water
0
20
40KM
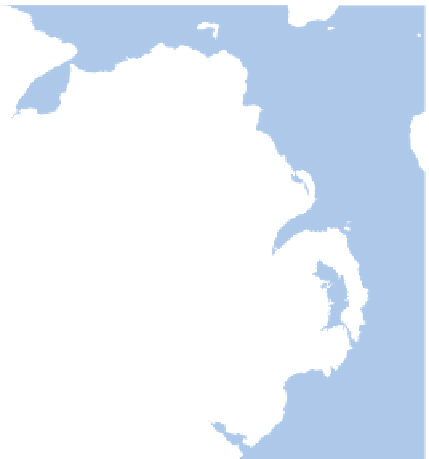
Figure 2.7
Precipitation amounts in Northern Ireland in July 2006.
is a choropleth map. With such maps, ranges of values are assigned a particular shad-
ing or colour. In other words, the possible values are divided into classes (typically i ve
or less). Choropleth maps ot en show areas of uniformity separated from one another by
abrupt edges (Tate
et al.
, 2008). h e map is then a function of the classes used to dis-
play values and the form of the zones for which the values are provided—that is, in the
same way that the zones are merely one possible way of spatially dividing a continuously
varying phenomenon so are the classes used to represent values one way of subdivid-
ing the full range of values. It has been argued that one way of reducing such problems
is to convert areal data into surfaces (Tate
et al.
, 2008; see Section 9.9). Figure 2.7
shows a map of point values (precipitation amounts) represented using symbols of
dif erent sizes; this is a common means of displaying point values. Even simple
approaches open up complex issues—if a range of values is divided into i ve classes,
the dif erent class thresholds used may result in visually very dif erent maps than those
based on, say, six or seven classes. Figure 2.8 shows two dif erent groupings of the same
set of area values into three sets of dif erent classes. While both maps are based on the
same data, the patterns in the maps appear, in many respects, quite dif erent.
h ere are many more sophisticated means of visualizing spatial data, including
three dimensional visualizations (e.g. see Figure 9.5), familiar to users of Google Earth™
(http://earth.google.co.uk/), and cartograms. Cartograms distort the form of features
to highlight particular characteristics, for example zones with large populations may
be made proportionately larger than zones with small populations such that the modi-
i ed zones better rel ect the attributes that they contain. h roughout this topic, maps
and other visual outputs are presented as central components of the analyses of which
they are part. Introductions to various aspects of spatial data visualization are provided


Search WWH ::

Custom Search