Geography Reference
In-Depth Information
A
B
Value
High : 892
Low : 1
Not visible
Visible
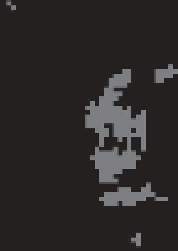
Figure 10.11
DEM (with elevations in metres) with a viewpoint superimposed (A)
and the viewshed from this location (B).
measured up to the distance to which objects will be visible and such considerations
must be taken into account when generating viewsheds. Viewsheds are used widely
in various contexts. One obvious use is generating viewsheds as part of the planning
process whereby the visual impact of a development on the landscape can be mini-
mized by identifying areas that are not visible from particular locations. Wheatley
(1995) used viewshed analysis to explore intervisibility between Neolithic long
barrows in the Danebury region (in south-west England). Fisher (1992) considers the
uncertainties inherent in viewsheds.
Another frequently generated product using DEMs is a cost surface. Cost surfaces
indicate the minimum cost of reaching a cell from source cells. To generate a cost sur-
face a friction surface and source cells are needed. h e friction surface is ot en simply
a gradient map—steep gradients represent a greater degree of friction or higher cost.
A cost surface can be generated using Dijkstra's algorithm, as outlined in Section 6.5.
When a DEM is generated using spatial interpolation, the interpolation method used
will determine how 'rough' the surface is and thus the modelled 'cost' of travelling over
the surface. Such factors, which may not relate to variations in the real world, should
be taken into account.
An example is given using the cost grid (e.g. gradient) and source cells (cell loca-
tions from which distance are measured) shown in Figure 10.12.
Cost distances are computed as follows:
•
neighbours sharing an edge
= average of costs in the neighbouring cells
(e.g. 45 + 44 =
89
/
2
= 44.5)


Search WWH ::

Custom Search