Geography Reference
In-Depth Information
532
S1
Population by
source zones
S2
734
T2
Target zones
T1
T3
230
11.35% of S2
302
43.16% of S1
Populations
reallocated to
areas of intersection
between source zones
and target zones
56.84% of S1
83
412
239
56.10% of S2
32.55% of S2
313
Aggregation of
populations
in target zones
714
239
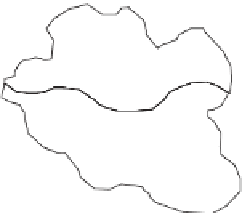
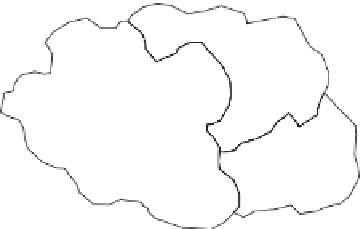
Figure 9.14
Areal weighting example.
according to the size of the overlapping areas between the old zone set and the new zone
set. Such an approach is called areal weighting and an example is given in Figure 9.14.
As a particular example, zone T1 covers 56.84% of the area of zone S1. Given this
information, the expected population of the area of overlap (i.e. intersection) between


Search WWH ::

Custom Search