Geography Reference
In-Depth Information
Solving the OK system, the weights are as follows:
l
1
= 0.368,
l
2
= 0.227,
l
3
= 0.234,
l
4
= 0.171, and
y
= 33.332.
h e predicted value is then given by: (0.368 ¥ 68) + (0.227 ¥ 29) + (0.234 ¥ 48) +
(0.171 ¥ 53) = 51.889.
h e kriging variance is given by: (0.368 ¥ 268.116) + (0.227 ¥ 311.250) + (0.234 ¥
311.983) + (0.171 ¥ 367.662) + (33.332 ¥ 1) = 338.537.
h e kriging variance is a useful by-product which, as detailed above, provides a
guide to uncertainty in predicted values.
h e 'true' precipitation amount value is 61 mm, so there is a prediction error of
9.111. In this case, the IDW prediction of 55.003 (see Section 9.5) is closer to the true
value, as is the TPS prediction of 60.569 (see Section 9.6). h ere is, of course, no guar-
antee that OK will provide more accurate predictions than IDW, despite the use of
arbitrary weights in the latter case, but many real-world case studies have shown how
techniques like OK ot en provide an increase in prediction accuracy over simpler
methods like IDW (see Lloyd (2005) for an example). Lloyd (2006) and Chang (2008)
provide worked examples of IDW, TPS, OK, and other approaches.
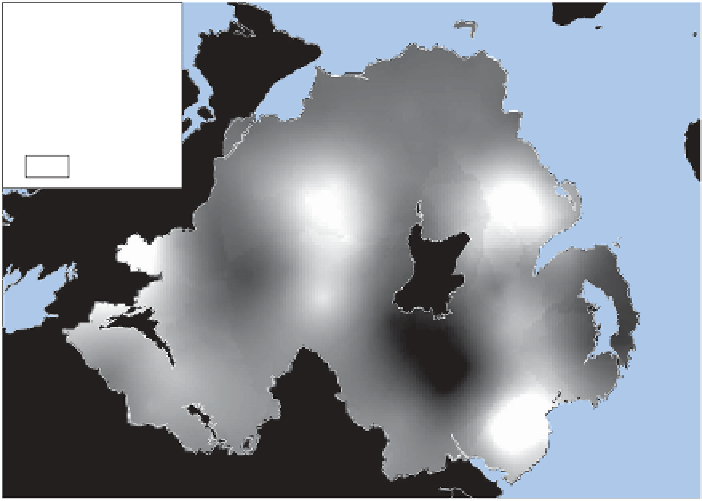
Figure 9.13 shows a map of precipitation in July 2006 generated using OK with 16
nearest neighbours.
Comparison of Figure 9.13 with Figures 9.7 (IDW derived map) and 9.8 (TPS derived
map) shows quite large dif erences in the range of values. h is demonstrates the large
variations that can result from the application of dif erent interpolation procedures.
h is issue is discussed further below.
Precipitation (mm)
V
alue
High : 110.45
N
Low : 38.72
Inland water
0
20
40 km
Figure 9.13
Precipitation in July 2006: OK prediction using 16 nearest neighbours.


Search WWH ::

Custom Search