Geography Reference
In-Depth Information
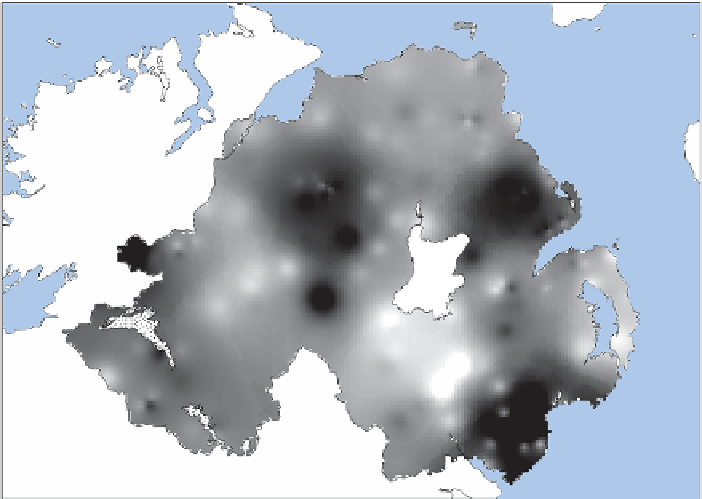
Precipitation (mm)
V
alue
High : 139.97
N
Low : 29.28
Inland water
0
20
40 km
Figure 9.7
Precipitation in July 2006: IDW prediction using 16 nearest neighbours.
exact or approximate. If the smoothing parameter is zero then the spline passes
through the data (it is an exact interpolator); if the value is greater than zero then the
spline is not forced to i t to the data (it is an approximate interpolator). If the data are
'noisy' (e.g. there is notable measurement error), use of a smoothing parameter may
be desirable. Large values of the smoothing parameter result in smoother maps. h e
TPS function
g
is made up of two parts (as dei ned at er the equation):
n
Â
g
()
x
=+ + +
a
a x
a y
l
R
(
x
-
x
)
(9.3)
0
1
2
i
i
i
=
1
h e aim is to i nd values of
a
0
,
a
1
,
a
2
, and
l
i
to make a prediction, as we know the
other terms (which will be detailed below) in advance. h e let -hand side of the equa-
tion (i.e.
a
0
+
a
1
x
+
a
2
y
) indicates the local trend in the data. h e introduction to this
chapter, as well as Section 9.4, mentioned trend surface analysis, in which a surface
(either a l at plane or a more complex surface) is i tted to the data in the same way that
a line is i tted to a scatter plot using regression. In the case of splines, a surface of this
kind is i tted to the data, but only to some local subset (e.g. the 16 nearest neighbours
to the prediction location). In the same way as a slope value is found in (bivariate)
linear regression and multiplied by the independent variable, we must i nd values for
a
1
and
a
2
, and these will be multiplied by
x
and
y
. h e term
R
(
x
-
x
i
) is called a basis
function and for TPS it is given by:
2
log
i
dd
(9.4)
i


Search WWH ::

Custom Search