Geography Reference
In-Depth Information
0
25
50 m
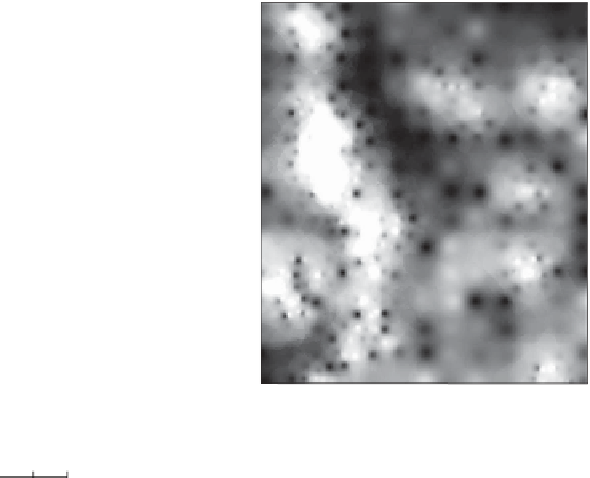
Concentration (ppm)
High : 1505.32
Low : 0.14
0
25 50 m
A
B
N
0
25 50 m
C
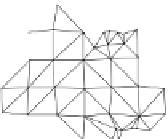
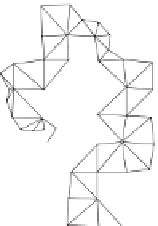
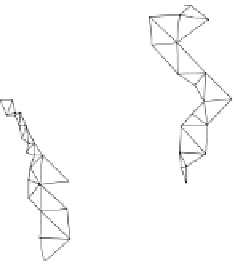
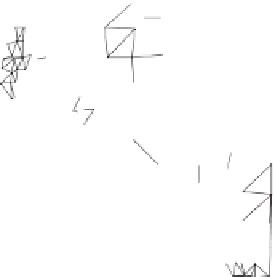
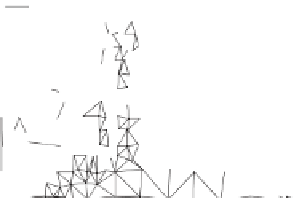
Figure 9.4
(A) Walker Lake sample data locations, (B) map derived using IDW
with eight nearest neighbours, and (C) TIN.
9.4.1
Trend surface analysis
As summarized in Section 9.2, a trend surface is i tted using regression, but instead
of regressing dif erent variables, values are predicted using a regression of the depen-
dent variable (e.g. elevation) against the coordinates or some function of them.


Search WWH ::

Custom Search