Geography Reference
In-Depth Information
interrogated through computing the Moran scatter plot, as described in Section 8.2,
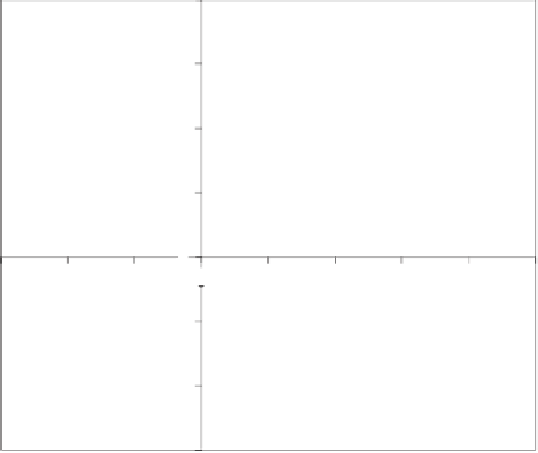
and this is shown in Figure 8.13. h e plot shows the value at location
i
plotted against
the weighted average of neighbouring values and the slope of the line i tted to the scat-
ter plot gives global Moran's
I
. h e plot allows assessment of outliers—those values
that do not i t the general trend. For example, there are some points in the right-hand
side of the upper right quadrant that fall far from the i tted line. Identifying these loca-
tions on a map could be informative, and this would be a sensible part of a fuller analy-
sis. Moran's
I
could be computed using a variety of dif erent bandwidths and changes
in results with change in bandwidth help to suggest the scales over which the property
is spatially autocorrelated.
An additional step that could be taken is to map the local
I
values, as in the case of
Figure 8.4. Moran scatter plots and local
I
can both be computed using the GeoDa
sot ware (Anselin
et al
., 2006).
8.7.2
Geographically weighted regression
For this analysis, the elevation data were provided as a digital elevation model (DEM)
and the values at each precipitation observation location were extracted; the DEM is
shown in Figure 10.17. A global regression of elevation and daily precipitation amount
suggests that the two are only weakly related—the
r
2
value was 0.0366 and the slope
parameter coei cient was negative. Intuitively, we would expect elevation and precipi-
tation to be positively related in at least some areas even for a period as short as a day
(note that, for the example for Northern Ireland given in Section 8.5.3, the data were
for monthly precipitation amounts). h e GWR sot ware (Fotheringham
et al.
, 2002)
400
I
= 0.722
300
200
100
0
300
200
100
0
100
200
300
400
500
100
200
300
z
i
Figure 8.13
Moran scatter plot for precipitation measurements: 10-km Gaussian bandwidth.


Search WWH ::

Custom Search