Geography Reference
In-Depth Information
Table 8.2
Values, differences from the mean, and weights
y
i
z
i
w
ij
w
ij
z
j
45
4.889
0.000
0.000
43
2.889
0.250
0.722
38
-
2.111
0.000
0.000
44
3.889
0.250
0.972
42
1.889
0.000
0.000
32
-
8.111
0.250
-
2.028
44
3.889
0.000
0.000
39
-
1.111
0.250
-
0.278
34
-
6.111
0.000
0.000
Sum
1.000
-
0.611
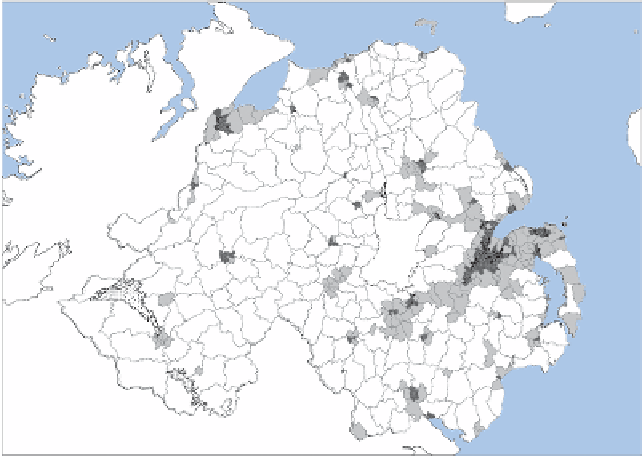
Log(Persons/ha)
-1.1-0.0
0.1-1.0
1.1-1.5
1.6-2.1
Inland water
N
0
20
40 km
Figure 8.3
Log of persons per hectare in Northern Ireland in 2001. Northern Ireland Census of
Population data—© Crown Copyright. Reproduced under the terms of the Click-Use Licence.
Figure 8.3. Global
I
was 0.665. In the case of
I
i
, there are large positive values in rural
areas (which have larger zones, since zone size is a function of the population density).
In urban areas like Belfast (in the east), the contrast between central areas with high
population densities and suburban and rural areas with lower population densities are
apparent. Areas with contrasting values are marked by small positive or negative val-
ues of
I
i
. Note that the results are a function of the particular form of zones used (see
Section 4.9 for a relevant discussion). h ere are many published applications of local
I
(e.g. Anselin, 1995; Lloyd, 2006).


Search WWH ::

Custom Search