Geography Reference
In-Depth Information
2500
PP1
PP2
E(K)
2000
1500
1000
500
0
0
5
10
15
20
25
Distance
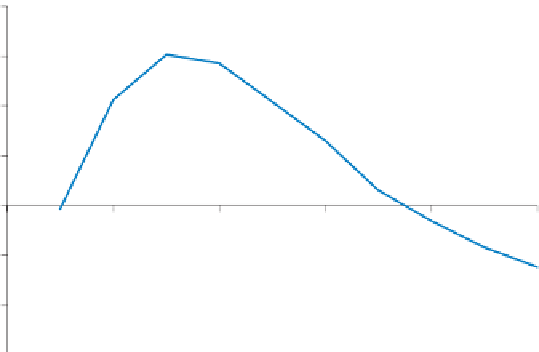
Figure 7.13
K
function and expected values (
E
(
K
)) for the point patterns in
Figures 7.1 (PP1) and 7.2 (PP2).
8
PP1
PP2
6
4
2
0
0
5
10
15
20
25
-2
-4
-6
Distance
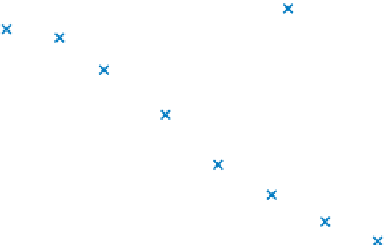
Figure 7.14
L
function for the point patterns in Figures 7.1 (PP1) and 7.2 (PP2).
distances. In an application that makes use of the
K
function, O'Brien
et al.
(2000)
demonstrate how dif erent forms of cancers in humans and dogs tend to cluster over
particular distance ranges. Such tools are a powerful means of assessing the structure
of point patterns and they may provide evidence to support further analyses (e.g. if
disease events cluster at particular scales we are likely to be interested in interpreting
this i nding).
An important issue in point pattern analyses concerns edge ef ects. Particularly for
larger distance bands, parts of the circles drawn around points may ot en fall outside


Search WWH ::

Custom Search