Geography Reference
In-Depth Information
where
n
is the number of events and
d
min
is the distance from the nearest event. In
words, the distance of each event
i
at location
x
i
to its nearest neighbour and the aver-
age of these distances are computed. h ese statistics are used to compute two other
measures called the
G
and
F
functions, which will be described next.
h e
G
and
F
functions allow the exploration of event to event nearest-neighbour
distances. h e
G
function is dei ned as the cumulative frequency distribution of the
nearest-neighbour distances. It is given by:
#(
d
(
x
)
<
d
)
min
i
(7.10)
Gd
()
=
n
In words,
G
(
d
) gives the proportion (since the count is divided by
n
) of nearest-neighbour
distances that are less than distance
d
. Obtaining
G
for dif erent values of
d
enables
assessment of the degree of clustering at dif erent spatial scales. For example, for a
clustered point pattern,
G
will increase markedly as distance increases for small dis-
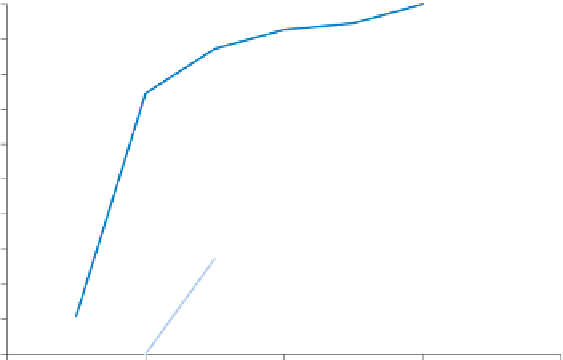
tances. For a regular point pattern the increase will be more gradual. Figure 7.12
shows the
G
function for the point patterns in Figures 7.1 (PP1) and 7.2 (PP2) for
distance steps of 2.5 units. Clearly, the values of
G
for PP1 are larger at smaller dis-
tances than they are for PP2, indicating the greater degree of clustering in PP1 than in
PP2. A value of 1 for
G
corresponds to distances that are larger than the maximum
nearest-neighbour distance for a given point pattern. In other words, for PP1, no
nearest-neighbour distance is greater than 15 units, while for PP2 no nearest-neighbour
distance is greater than 12.5 units.
h e
F
function is similar to the
G
function, but instead of the events a sample
of point locations is selected randomly from anywhere in the study area—that is,
1
0.9
PP 1
PP 2
0.8
0.7
0.6
0.5
0.4
0.3
0.2
0.1
0
0
5
10
15
20
Distance
Figure 7.12
G
function for the point patterns in Figures 7.1 (PP1) and 7.2 (PP2).


Search WWH ::

Custom Search