Agriculture Reference
In-Depth Information
3.5
3.015
2.83
3
2.72
2.52
2.5
2.3
1.9
1.85
2
1.55
1.5
1
0.5
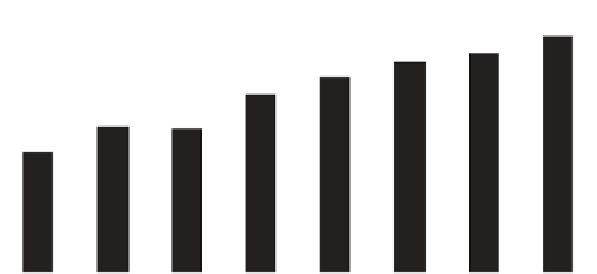
Figure 1.2
Goat population
changes in the U.S.
(1985-2007).
0
1985
1990
1995
2000
2002
2005
2006
2007
Years
Table 1.9
Changes in goat farming in the U.S. (1997-2007
*
).
Category
1997
2002
2007
% of total
% of 1997
All goats
Farms
76,543
91,462
119.5
Number of goats
2,251,613
2,530,466
3,015,000
100
134.0
*
Farms selling goats
29,937
43,495
145.3
Number of goats sold
843,773
1,314,310
155.8
Meat goats
Farms
63,422
74,980
118.2
Number of goats
1,231,762
1,938,924
2,500,000
83
203.0
*
Farms selling goats
24,539
36,403
148.3
Number of goats sold
532,792
1,109,619
208.3
Dairy goats
Number of farms
15,451
22,389
145
*
Number of goats
190,588
290,789
305,000
10
160.0
Farms selling goats
5,163
8,850
171.4
Number of goats sold
72,307
113,654
157.2
Angora goats
Number of farms
5,485
5,075
92.5
Number of goats
829,263
300,753
210,000
7
28.7
*
Farms selling goats
1,883
1,662
88.3
Number of goats sold
238,674
91,037
38.1
* Refl ects the 2007 USDA-NASS sample data.
Import and Export of Goat Meat
The United States was a net exporter of goat meat before
1990. Exports ceased in 1994 due to an increased domestic
demand. This shift refl ects increased goat meat consump-
tion nationally. In 2007, the U.S. imported 10,166 MT,
nearly 23 million pounds (lb) of goat meat valued at USD
of meat goats (213% and 197%, respectively); Iowa expe-
rienced an increase in the number of dairy goats (220%);
and although the number of Angora goats continued to
decline, Colorado, Nebraska, Minnesota, and Missouri
experienced more than an 80% increase in the number of
Angora goats since 2002.


