Agriculture Reference
In-Depth Information
16
14
12
10
Goat meat
Goat Milk
8
6
4
2
0
Years
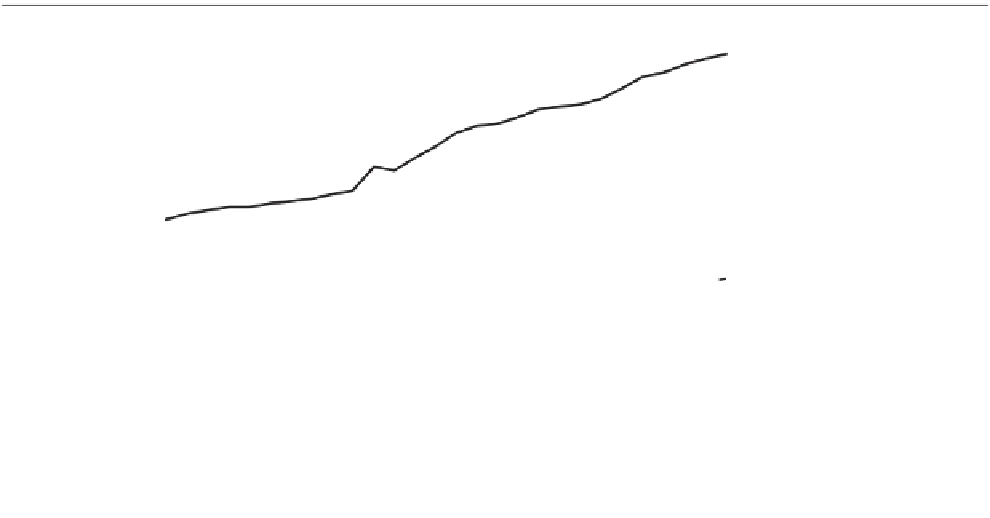
Figure 1.1
Changes in global goat meat and milk production (FAOSTAT, 2007).
Table 1.5
Top producers of goat meat.
Table 1.6
Top producers of goat milk.
Country
Goat meat (MT)
%
Country
Goat milk (MT)
%
China
2,253,678
43.8
India
3,823,000
25.8
India
527,000
10.2
Bangladesh
2,016,000
13.6
Pakistan
350,000
6.8
Sudan
1,450,000
9.8
Bangladesh
195,000
3.8
Pakistan
699,000
4.7
Sudan
186,000
3.6
France
590,000
4.0
Nigeria
148,830
2.9
Greece
500,000
3.4
Iran, Islamic Republic
106,000
2.0
Spain
488,500
3.3
Indonesia
63,410
1.2
Somalia
393,000
2.6
Greece
58,000
1.1
Iran, Islamic Republic
370,000
2.5
Mali
52,820
1.0
China
268,000
1.8
Others
1,214,504
23.6
Others
4,218,152
28.5
World
5,146,202
100
World
14,800,534
100
Source: FAOSTAT, 2007 .
Source: FAOSTAT, 2007 .
Tables 1.5 and 1.6 summarize the contributions of
the top 10 countries to global goat meat and milk pro-
duction. Goat meat and milk are important in most parts
of the world particularly in the developing countries.
Production parallels the size of goat populations. More
than 60% of the total world goat meat was produced
by China, India, and Pakistan in 2007. At the same
time, almost 50% of the goat milk was produced by
India, Bangladesh, and Sudan, and more than 70% of milk
was produced in the top 10 countries in goat milk
production.
Among exporting countries, Australia leads the world in
goat meat exports with 21,952 MT exported in 2006 (the
latest data available on the FAOSTAT website in 2009)
and 41.1% of the total world market. Ethiopia claimed
25.7% of the export market, followed by China (8.9%),
Pakistan (7.4%), and France (5.4%). More than 80% of
the goat meat was exported by the top seven countries
(Table 1.7 ).
The top importers of goat meat were the U.S. with
22.6%, followed by United Arab Emirates (16.7%), and
China (15.5%). Collectively, these three countries import


