Database Reference
In-Depth Information
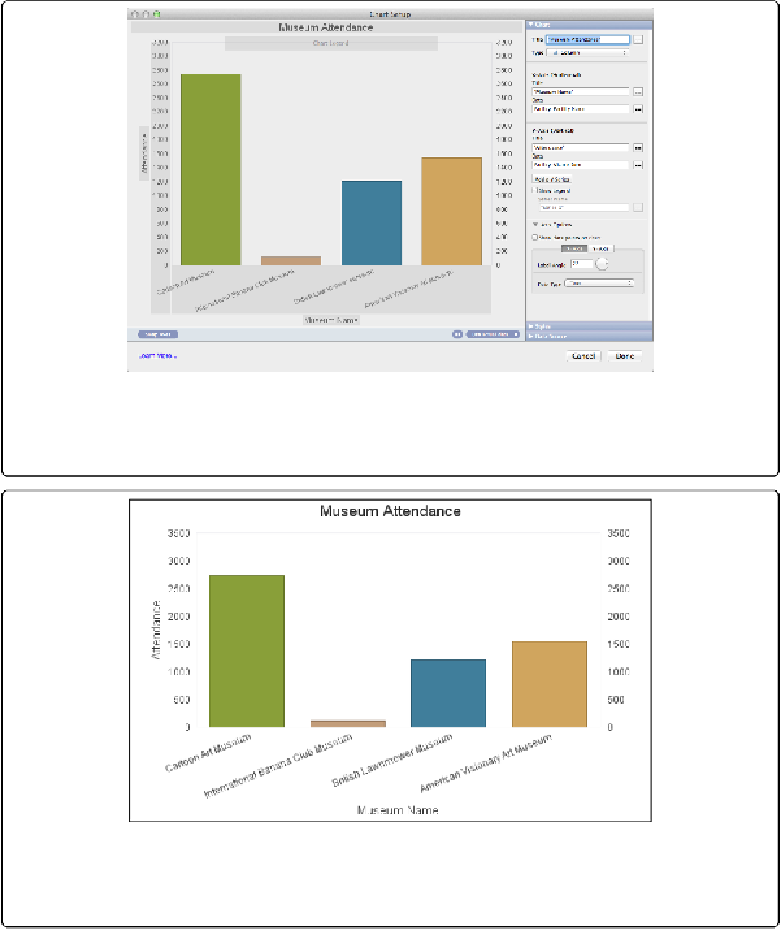
Figure 15-18. The Format Chart dialog box is where the real magic happens. Clicking on any
dark-grey box in the chart preview area will select the area on the right where that area is con-
figured.
Figure 15-19. With axis labels turned 22 degrees, the columns are now clearly identified. The axis
titles you added make it abundantly clear to the viewer that museum names run along the X axis,
and attendance numbers the Y axis.

