Graphics Programs Reference
In-Depth Information
(Keep in mind that some things just take time. Redrawing the entire screen every time the
user's finger moves, as is done in
TouchTracker
, is an expensive operation. If it was
hindering the user experience, you could find a way to reduce the number of times the
screen is redrawn. For example, you could redraw only every tenth of a second regardless
of how many touch events were sent.)
Time Profiler
shows you nearly every function and method call in the application. If you
want to focus on certain parts of the application's code, you can prune down its results.
For example, sometimes the
mach_msg_trap
function will be very high on the sample
list. This function is where the main thread sits when it is waiting for input. It is not a bad
thing to spend time in this function, so you might want to ignore this time when looking at
your
Time Profiler
results.
Use the search box in the top right corner of the
Instruments
window to find
mach_msg_trap
. Then, select it from the table. On the left side of the screen, click the
Symbol
button under
Specific Data Mining
. The
mach_msg_trap
function appears in
the table under
Specific Data Mining
, and the pop-up button next to it displays
Charge
.
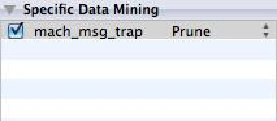
Click on
Charge
and change it to
Prune
. Then, clear the text from the search box. Now,
the list is adjusted so that any time spent in
mach_msg_trap
is ignored. You can click
on
Restore
while
mach_msg_trap
is selected in the
Specific Data Mining
table to add
it back to the total time.
Figure 21.18 Pruning a symbol
Other options for reducing the list of symbols in
Time Profiler
include showing only
Objective-C calls, hiding system libraries, and charging calls to callers. The first two are
obvious, but let's look at charging calls to callers. Select the row that holds
mach_absolute_time
. (If you are running on the simulator, select
_nanotime
in-
stead.) Then, click the
Symbol
button. This function disappears from the main table and
reappears in the
Specific Data Mining
table. Notice that it is listed as a
Charge
. This
means that the time spent in this function will be attributed to the function or method that
called it.
Back in the main table, notice that
mach_absolute_time
has been replaced with the
function that calls it,
gettimeofday
. If you take the same steps to charge
get-