Graphics Programs Reference
In-Depth Information
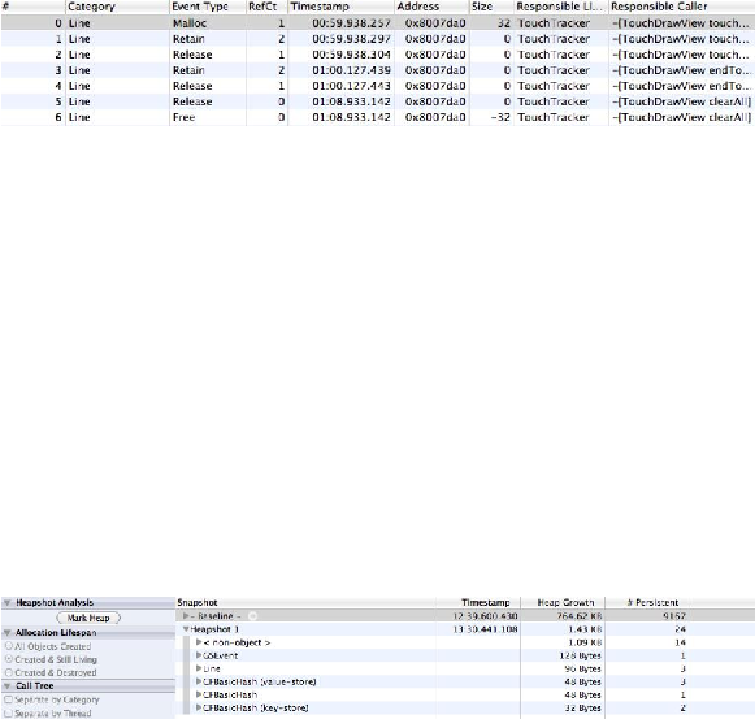
You've seen this information before, but after turning on
Record reference counts
, there is
much more of it. Each time the selected
Line
instance gained an owner, a
Retain
event
was added to this table. Each time the line lost an owner, a
Release
event was added to the
table. The
RefCt
column tells you the number of owners a
Line
has after that event. You
can click on a row to see the stack trace that caused that event.
Heapshot analysis
The last item we'll examine in the
Allocations
instrument is
Heapshot Analysis
. First,
clear the search box so that you aren't filtering results anymore. Then, find the
Heapshot
Analysis
category on the left side of the
Instruments
window and click
Mark Heap
. A cat-
egory named
Baseline
will appear in the table. You can click the disclosure button next to
this category to see all of the allocations that took place before you marked the heapshot.
Now draw more lines in
TouchTracker
and click
Mark Heap
again. Another category will
appear named
Heapshot 1
. Click the disclosure button next to
Heapshot 1
(
Figure 21.15
).
Figure 21.15 Heapshot
Every allocation that took place after the first heapshot is in this category. You can see the
Line
instances that you just created as well as a few objects that were used to handle oth-
er code during this time. You can take as many heapshots as you like; they are very useful
for seeing what objects get allocated for a specific event. Double-tap the screen in
TouchTracker
to clear the lines and notice that the objects in this heapshot disappear.
To return to the full object list where we started, select the pop-up button in the bread-
crumb bar that currently says
Heapshots
and change it to
Statistics
.