Graphics Programs Reference
In-Depth Information
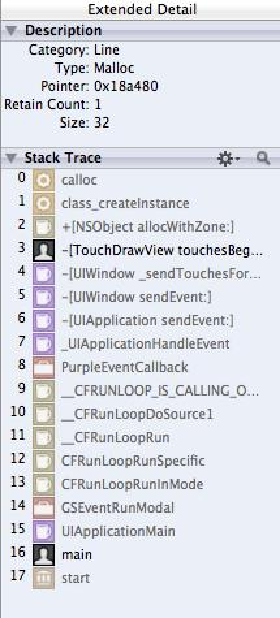
Each row in this table shows a single instance of
Line
that has been created. Select one
of the rows and check out the stack trace that appears in the
Extended Detail
area on the
right side of the
Instruments
window (
Figure 21.10
)
. This stack trace shows you where
that instance of
Line
was created. Grayed-out items in the trace are system library calls.
Items in black text are your code. Find the top-most item that is your code (
-
[TouchDrawView touchesBegan:withEvent:]
) and double-click it.
Figure 21.10 Stack trace
compared to the other calls in this method. For example, the
Line
instance makes up
about 47 percent of the memory allocated by
touchesBegan:withEvent:
.