Graphics Programs Reference
In-Depth Information
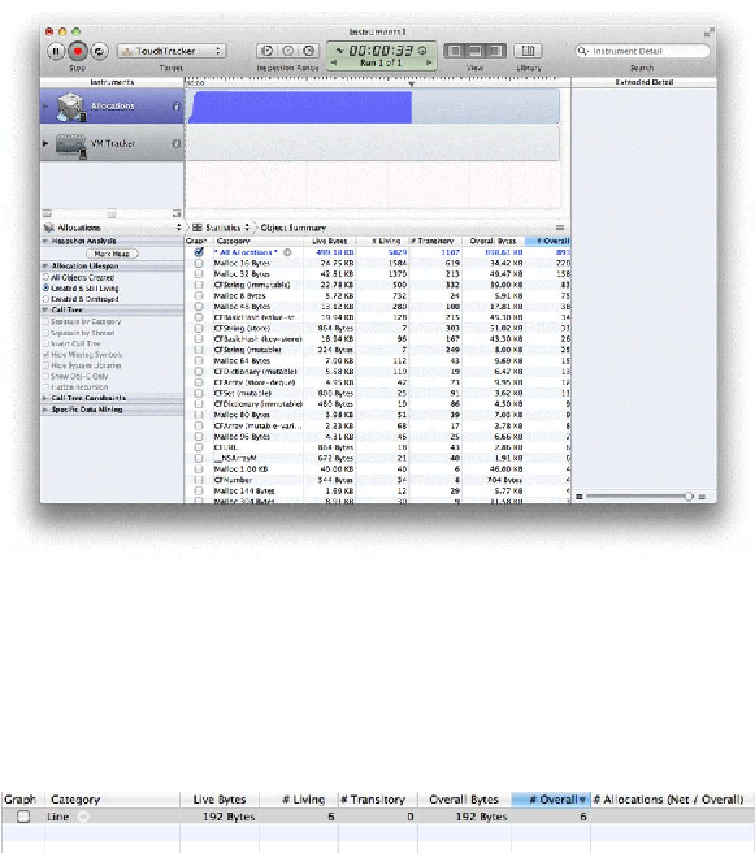
This table shows every memory allocation in the application. There are a lot of objects
here, but let's look at the objects that your code is responsible for creating. First, draw
some lines in
TouchTracker
. Then, type
Line
in the
Instrument Detail
search box in the
top right corner of the window.
This will filter the list of objects in the
Object Summary
table so that it only shows in-
Figure 21.7 Allocated Lines
The
# Living
column shows you how many line objects are currently allocated.
Live
Bytes
shows how much memory these living instances take up. The
# Overall
column
shows you how many lines have been created during the course of the application - even
if they have since been deallocated.