Graphics Programs Reference
In-Depth Information
Instruments
The static analyzer is useful for catching issues that can be recognized at compile time.
However, some problems can't be recognized until runtime. This is where
Instruments
ex-
cels. The
Instruments
tool monitors your application while it is running and can find real is-
sues as they are happening.
Instruments
is made up of several plug-ins that enable you to
inspect things like what objects are allocated, where the CPU is spending its time, file I/O,
network I/O, and others. Each plug-in is known as an
Instrument
. Together, they help you
track down inefficiencies in your application and optimize your code.
When you use
Instruments
to monitor your application, you are
profiling
the application.
While you can profile the application running on the simulator, you will get more accurate
data on a device.
Allocations Instrument
The
Allocations
instrument tells us about every object that has been created and how much
memory it takes up.
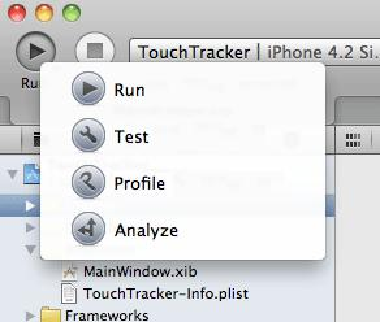
To profile an application, click and hold the
Run
button in the top left corner of the work-
space. In the pop-up menu that appears, select
Profile
(
Figure 21.4
).
Figure 21.4 Profiling an application