Graphics Programs Reference
In-Depth Information
Using the Debugger
When an application is launched from
Xcode
, the debugger is attached to it. The debugger
monitors the current state of the application, like what method it is currently executing and
the values of the variables that are accessible from that method. Using the debugger can
help you understand what an application is actually doing, which, in turn, helps you find
and fix bugs.
Using breakpoints
One way to use the debugger is to set a
breakpoint
. Setting a breakpoint on a line of code
pauses the execution of the application at that line (before it executes). Then you can ex-
ecute the subsequent code line by line. This is useful when your application is not doing
what you expected and you need to isolate the problem.
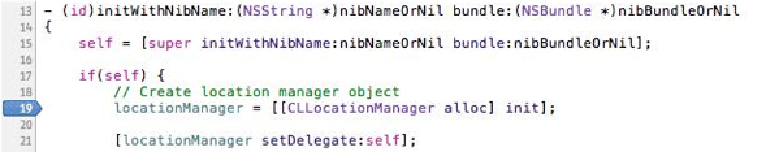
In
WhereamiViewController.m
, find the line of code in
initWithNibName:bundle:
where you instantiate the
CLLocationManager
. Set
a breakpoint by clicking the gutter (the lightly shaded bar on the left side of the editor area)
next to that line of code (
Figure 4.9
). The blue indicator shows you where the application
will “break” the next time you run it.
Figure 4.9 A breakpoint
Build and run the application. The application will start and then halt before the line of
code where you put the breakpoint. Notice the green indicator that appears on the same line
as the breakpoint. This indicator shows you the current point of execution.
Now our application is temporarily frozen in time, and we can examine it more closely. In
the navigator area, click the icon to open the
debug navigator
. This navigator shows a
stack trace
of where the breakpoint stopped execution. A stack trace shows you the meth-
ods and functions whose frames were in the stack when the application broke. The slider at