Environmental Engineering Reference
In-Depth Information
Evaporation can be measured directly by using water-filled
shallow metal Class A evaporation pans, and keeping
records of the amount of water added to replenish the pan
on a daily basis to maintain a predetermined maximum level.
Because the water temperature in the pans tries to equilibrate
with the temperature of the air, however, a conversion factor
is required to relate evaporation rates in the pan to land or
water evaporation rates. Typically, pan evaporation rates, in
inches, are multiplied by 0.7 to get estimates of evaporation
from water bodies much larger than the shallow pan.
A precipitation gage should be placed near the pan to record
rainwater added to the pan during the evaporation-measurement
period.
2.3.5 Transpiration
In 1699, John Woodward (Kramer and Boyer 1995)
observed plants he was growing in a liquid culture and stated
that
the greatest part of the fluid mass (water) that ascends up
into plants does not settle there but passes through their pores
and exhales up into the atmosphere.
...
The process he was describing more than 300 years ago is
transpiration. Transpiration is the evaporative loss of water
from living plants. Transpiration produces about 75% of the
water vapor over land surface and about 13% of the water
vapor around the globe (Von Caemmerer and Baker 2007).
Even dormant plants can lose water by transpiration. Tran-
spiration of water from a leaf can be viewed as being similar
to the evaporation of water from the free surface of exposed
water, as described above, except that the water vapor must
first travel through water-conducting structures within the
plant to the leaf to reach the air (Fig.
2.7
). At the most basic
level, the same physical factors that influence evaporation
from the surface of an exposed water surface also affect the
transpiration of water from a leaf, such as the relative
humidity of the air, and the amount of incoming solar radia-
tion that impinges on the leaf. Unlike open surfaces of water,
however, plant anatomy and water-conducting structures
have the ability to resist evaporation, which is discussed in
Chap. 3.
The rate of transpiration can be described by using
Eq.
2.8
:
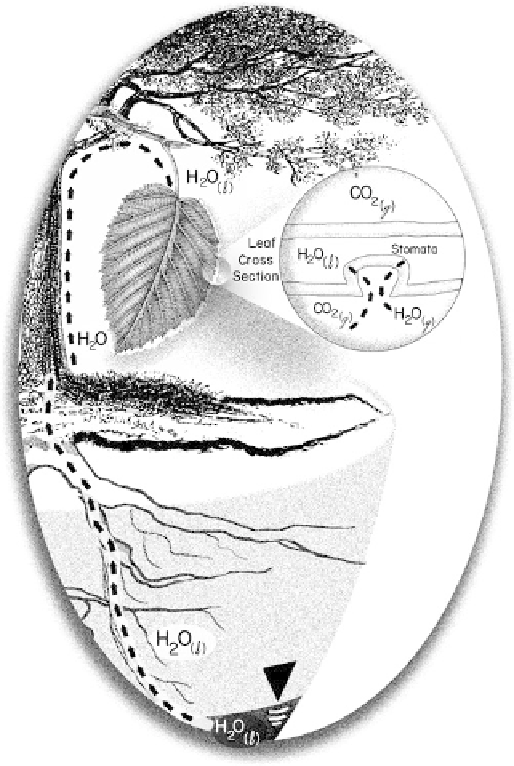
Fig. 2.7
The loss of water vapor, H
2
O
(g)
by diffusion from leaves
during transpiration following uptake by root hairs in the subsurface
and translocation of H
2
O
(l)
to the leaves. This is a consequence of the
diffusion of CO
2(g)
into leaves which stimulates photosynthesis and the
production of a stored source of energy.
resistance to this vapor transfer by the structure of the leaf.
Ultimately, it is the transpiration of water along this vapor-
pressure gradient that moves water from the roots to the
atmosphere. Changes in physical factors, such as light inten-
sity, will affect variables in Eq.
2.8
, such as
R
leaf
. This can
lead to a change in the physical status of the plant itself. For
example, the loss of water will act to lower the leaf temper-
ature and, therefore, under conditions of rapid transpiration,
the leaf temperature of a plant may be lower than the air
temperature.
In addition to the physical factors related to meteorologi-
cal processes that occur above ground, physical properties of
the soil, such as soil moisture content, porosity, and hydrau-
lic conductivity, also play a role in controlling the maximum
rate of transpiration. This is because water first must be
moved from reservoirs of water in the ground to the root
system. An example of the effect of soil properties on the
transpiration of plants is the previously mentioned wilting
T
¼
C
leaf
C
air
=
R
leaf
þ
R
air
;
(2.8)
where
T
is the rate of transpiration,
C
leaf
is the vapor con-
centration inside the leaf tissue, and
R
leaf
is the resistance to
vapor diffusion in the leaf (Kramer and Boyer 1995). Hence,
transpiration,
T
, is proportional to the difference in vapor
concentration between the leaf and air, normalized by any

Search WWH ::

Custom Search