Environmental Engineering Reference
In-Depth Information
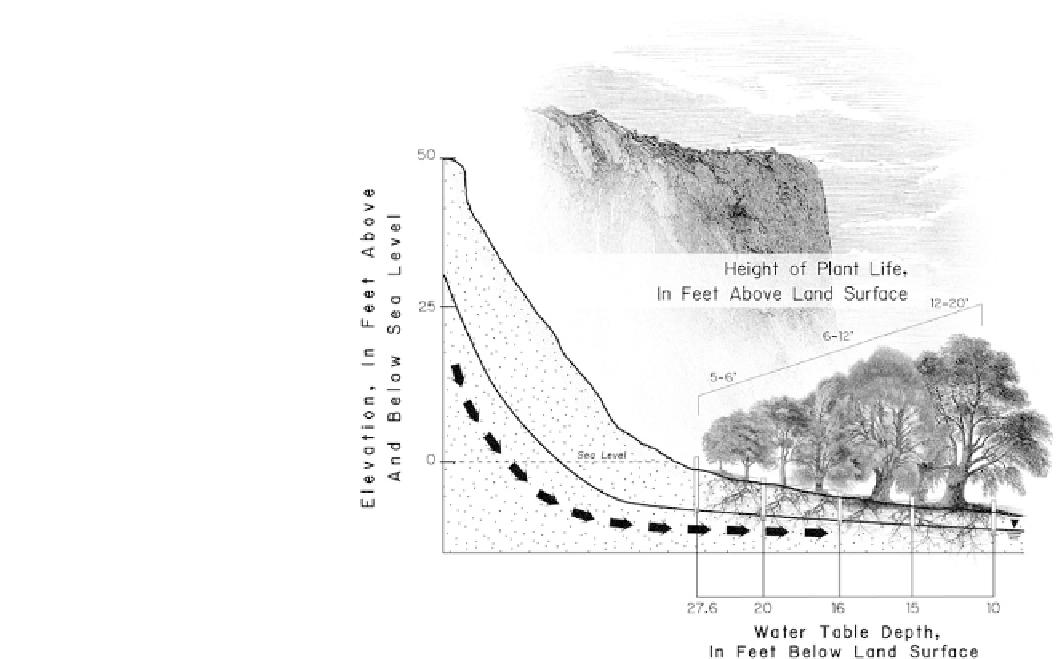
Fig. 1.11
Diagram of a cross
section showing that as the depth
to groundwater in wells decreased
the height and size of mesquite
(
Prosopis glandulosa
) trees
increased (Modified from Brown
1923). The arrows represent
groundwater flow.
this case at a nonirrigated field of alfalfa, is depicted in
Fig.
1.12
.
White also investigated plant-induced, groundwater-level
fluctuations in separate fields composed of greasewood, shad
scale, salt grass, and sedges and marsh grasses. The maxi-
mum groundwater drawdown observed ranged from 1.5 to
4.25 in. (up to 10.7 cm). As would be expected, the greatest
drawdown occurred when the plant growth was the densest
and the plants were growing rapidly. White also measured
groundwater-level fluctuations in a thicket of willow trees, a
plant more representative of the type often used in
phytoremediation applications to address groundwater con-
tamination. In such willow thickets, White noted maximum
fluctuations in the water table of 3.75 in. (9.5 cm) during hot,
clear weather in the summer, with no groundwater
fluctuations in October after
some of the plants had been removed. To do this, water-level
recorders were placed in wells in a field of alfalfa during the
summer of 1926 and measured for a few days before and
after the alfalfa was cut. The result on both the elevation and
daily fluctuation in the water table is shown in Fig.
1.14
.
These experiments were performed during periods of no
precipitation, so the changes in the groundwater levels
observed could be directly related to the presence or absence
of phreatophytes.
White used similar field data to develop an empirical
equation to describe groundwater use by transpiring plants
during a 24-h period. This is an important contribution
because it determines the water used by a plant that is
attributed specifically from groundwater, not soil moisture.
White's equation also can be used to compute the specific
yield, or volume of groundwater that will flow due to grav-
ity, of an aquifer based on plant-induced groundwater-level
drawdown measurements (White 1932). White's equation is
frost and leaf drop had
occurred.
The lack of groundwater-level fluctuation in wells in
cleared fields further supported White's conclusions that
plant uptake of groundwater caused the observed daily rise
and fall of the water table in planted areas. As shown in
Fig.
1.13
, groundwater-level fluctuations were observed in a
field of greasewood but not in cleared land during the same
monitoring period.
A similar method was employed by White to test the
hypothesis that plants affect the water-table level, although
he measured the groundwater fluctuation before and after
Q
¼
y
24
r
ð
þ
s
Þ
(1.1)
Where
Q
is the depth of groundwater transpired (inches
or centimeters),
y
is the specific yield of the soil zone in
which the observed groundwater-level fluctuation occurs
(% by volume),
r
is the hourly rise in water table, or rate
of groundwater inflow, in length per time from 12:00 to
4:00 a.m., the time of assumed zero transpiration when
Search WWH ::

Custom Search