Environmental Engineering Reference
In-Depth Information
between 10
F and 20
F(
6
C). Within each
zone, plants more characteristic of a higher numbered zone
usually can survive near bodies of surface water or large
buildings, which broadens the lower range for a particular
zone. Trees that grow best in zone eight, however, likely
would not survive if planted in a lower zone, such as zone
five. Table
6.1
presents the hardiness zones for some
phreatophytes that can be used for phytoremediation.
as media for samples of the plants proposed for use at the
site. In this manner, the level of contaminant that is toxic to a
particular plant can be assessed before an entire phytore-
mediation system is installed correctly but fails to thrive as
anticipated.
Most laboratory studies that are performed at a site are
based on questions about the interactions between plants,
water sources and availability, and groundwater conta-
minants. Part of this interaction leads to questions regarding
the potential increase in risk exposure to human and wildlife
populations caused by planting trees at a contaminated site.
Laboratory-scale experiments are an approach to provide
answers to these questions, and are discussed specifically
in Chaps. 12 and 16.
12 to
Table 6.1
Preferred hardiness zones for trees typically used in
phytoremediation.
Tree
Preferred hardiness zone, USDA
Birch, white
2-7
Birch, river
3-7
Willow oak
6-9
Willow, weeping
2-10
6.4.4 Weather and Climate
Sycamore
5-10
Populus
spp.
2-10
Eucalyptus
spp.
9-10
The interactions between weather and plant distribution and
growth are known generally to be inseparable, as was
recorded as early as the first century
AD
by Pliny the Elder
(see Chap. 1). The relation of periods when light, air tem-
perature, soil moisture, humidity, and precipitation are opti-
mal for plant growth defines the growing season for specific
plants in specific regions of the world. For example, air
temperature affects the rate of plant metabolism. In general,
most plants can maintain metabolism between 35
F and
110
F (1.6-43
C). Short periods of exposure to sub-optimum
temperatures, such as nighttime freezes, can result in the
death of actively growing parts of a plant but the whole
plant usually survives. Longer exposure to such conditions,
however, generally results in plant death.
Under natural conditions, different plants have accli-
mated to a unique range of temperatures. The widespread
natural distribution across North America, Asia, and Europe
of the Genus
Populus
, for example, is one reason why poplar
trees are commonly used for phytoremediation projects. The
distribution of
Populus
and its affect on phytoremediation
are discussed in Chap. 7.
The acclimation of different plants to different ranges in
air temperature led the U.S. Department of Agriculture
(USDA) to make maps that depict zones of plant hardiness,
or tolerance to low-temperature extremes. These maps
divide the United States into ten hardiness zones, located
roughly horizontally across the country, as a function of
temperature changes related to changes in latitude. Zone
one is in the far northern United States and zone ten is in
the far south. Each zone contains plants adapted to the
average minimum air temperature in the zone. The deter-
mining factor of the success of a particular plant is the lowest
temperature that it can survive without death of the roots.
South Carolina, for example, is in hardiness zone eight,
characterized by average minimum air
Baldcypress
5-10
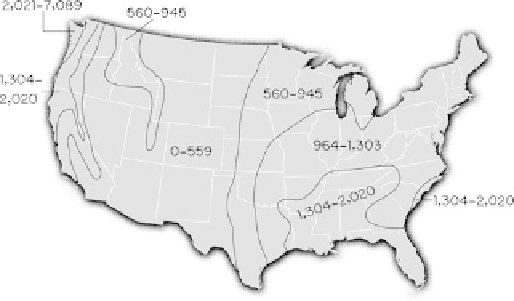
6.4.4.1 Precipitation Maps
Precipitation amounts that tend to fluctuate annually for a
particular area generally approach a fairly stable long-term
average amount. Because of the reliance of plants on water,
plant distribution closely follows precipitation abundance.
Humid areas typically have more than 20 in. (50.8 cm) of
precipitation per year, and areas with less than 10 in./year are
considered arid. Between these two extremes are semi-arid
areas. The average precipitation in each area constrains plant
growth, like air temperature, especially in terms of
establishing a phytoremediation planting (Fig.
6.2
).
Not only is the amount of precipitation important, but
also the timing, duration, and intensity of precipitation. The
relation between precipitation and soil characteristics is
important to plant distribution, because even high precipita-
tion amounts that suggest
a priori
plant growth may not be
Fig. 6.2
Average annual precipitation, in millimeters, from 1980 to
1997, for the conterminous United States (Modified from Healy et al.
2007). One millimeter is equivalent to 0.039 in.
temperatures


Search WWH ::

Custom Search