Information Technology Reference
In-Depth Information
R5#
show ip route
Codes: C - connected, S - static, I - IGRP, R - RIP, M - mobile, B - BGP
<output omitted>
* - candidate default, U - per-user static route, o - ODR
P - periodic downloaded static route
Gateway of last resort is 10.10.10.13 to network 0.0.0.0
10.0.0.0/30 is subnetted, 4 subnets
R 10.10.10.0 [120/3] via 10.10.10.13, 00:00:21, Serial0/0/0
R 10.10.10.4 [120/2] via 10.10.10.13, 00:00:21, Serial0/0/0
R 10.10.10.8 [120/1] via 10.10.10.13, 00:00:21, Serial0/0/0
C 10.10.10.12 is directly connected, Serial0/0/0
172.16.0.0/16 is variably subnetted, 10 subnets, 5 masks
R 172.16.1.0/27 [120/2] via 10.10.10.13, 00:00:21, Serial0/0/0
C 172.16.1.32/28 is directly connected, FastEthernet0/1
R 172.16.1.192/26 [120/3] via 10.10.10.13, 00:00:21, Serial0/0/0
R 172.16.2.0/26 [120/4] via 10.10.10.13, 00:00:21, Serial0/0/0
R 172.16.2.64/27 [120/1] via 10.10.10.13, 00:00:21, Serial0/0/0
R 172.16.3.0/25 [120/2] via 10.10.10.13, 00:00:21, Serial0/0/0
R 172.16.3.128/26 [120/3] via 10.10.10.13, 00:00:21, Serial0/0/0
R 172.16.3.192/29 [120/4] via 10.10.10.13, 00:00:21, Serial0/0/0
R 172.16.4.0/27 [120/1] via 10.10.10.13, 00:00:21, Serial0/0/0
C 172.16.4.128/25 is directly connected, FastEthernet0/0
R 192.168.1.0/24 [120/2] via 10.10.10.13, 00:00:21, Serial0/0/0
R* 0.0.0.0/0 [120/2] via 10.10.10.13, 00:00:21, Serial0/0/0
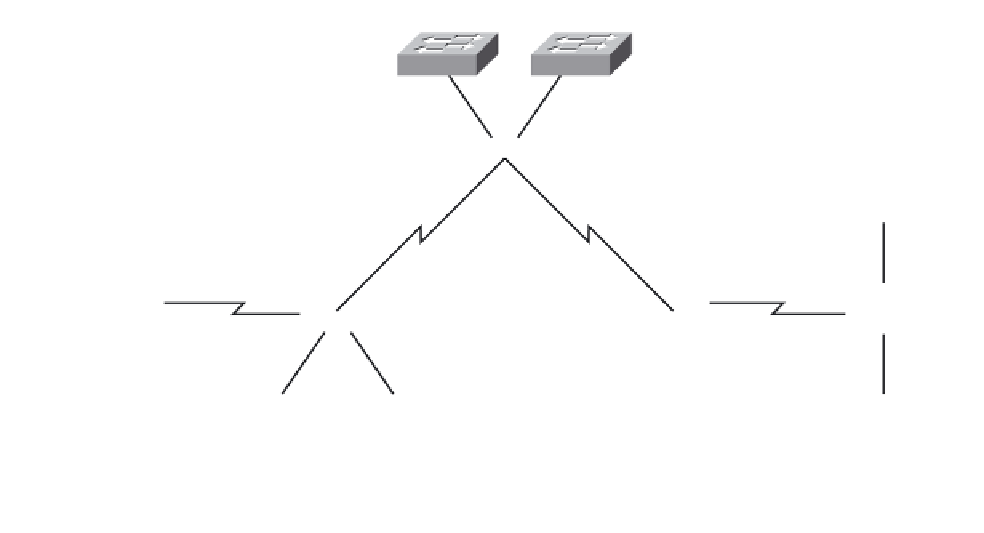
Task 2: Create a Diagram of the Network Based on the show
ip route Output on Routers R1-R5
Draw a diagram of the network based on your interpretation of the router outputs in the
following space provided in Figure 8-5.
Step 1.
Figure 8-5
Topology Diagram for Lab 8-2 (Answer)
172.16.1.0/27
172.16.3.0/25
Fa0/0
Fa0/1
Lo0
192.168.1.0/24
172.16.2.0/26
172.16.4.128/25
R1
S0/0/0
S0/0/1
10.10.10.4/30
10.10.10.8/30
Fa0/0
Fa0/0
S0/0/0
S0/0/0
10.10.10.12/30
S0/0/1
S0/0/0
S0/0/1
R3
R2
R4
R5
10.10.10.0/30
Fa0/1
Fa0/1
Fa0/0
Fa0/1
Fa0/0
Fa0/1
172.16.3.192/29
172.16.3.128/26
172.16.1.192/26
172.16.4.0/27
172.16.2.64/27
172.16.1.32/28