Biology Reference
In-Depth Information
B
C
A
D
E
F
G
H
I
0
8
16
24
8
16
24
0
8
16
Time of day (h)
24
8
16
24
0
8
16
24
8
16
24
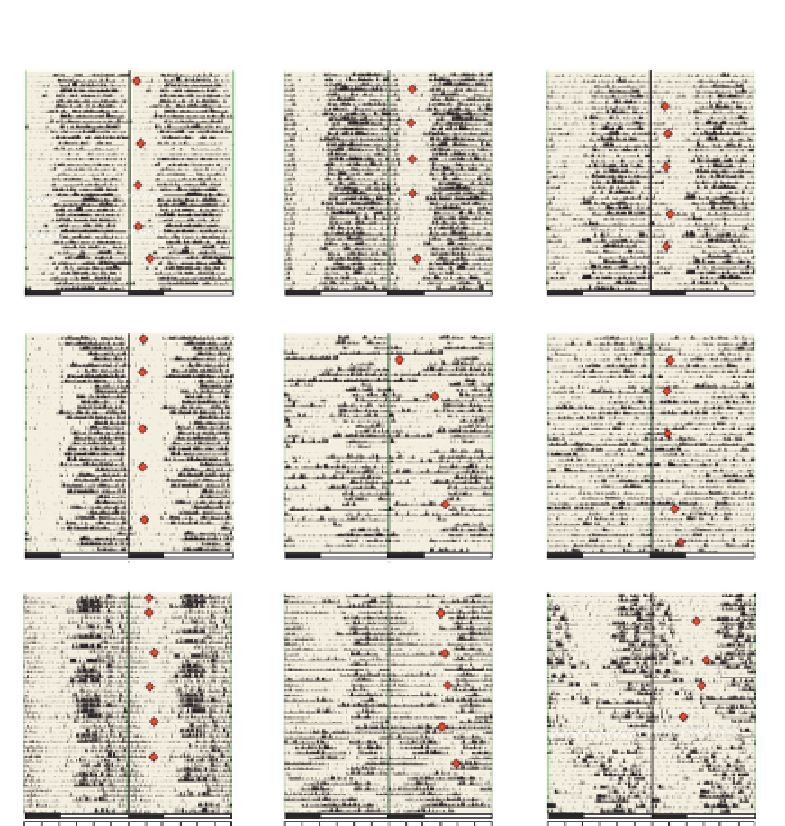
Figure 11.6 Six weeks of rest-activity patterns (actograms) and melatonin peak times
(dots) from subjects' in their home environment. Activity data are 48-h double plotted.
Black bars on the x-axis indicate nighttime, open bars indicate daytime, and the midline
indicates midnight. (A-C) Unemployed individuals showing clear entrainment to the
day/night cycle and low nighttime activity. (D-I) Actograms of patients with schizophre-
nia showing disrupted sleep patterns ranging from: (D) entrained but with variable
sleep onsets and periods; (E) disrupted, and (F) highly irregular rest-activity cycles;
(G) highly delayed rest-activity periods with bedtimes around 04:00; (H) reversed
rest-activity cycles alternating with free-running periods; and (I) delayed rest-activity
Search WWH ::

Custom Search