Information Technology Reference
In-Depth Information
As with all such positive feedback systems, there
is a potential for
runaway positive feedback
(e.g., like
we saw with bidirectional excitatory connectivity in the
previous chapter). This phenomenon is manifest in
the self-organizing learning case as individual receiv-
ing units that end up representing a disproportionate
number of input features, while other receiving units
represent very few or no such features. One impor-
tant check against this “hogging” phenomenon happens
when learning causes units to become more
selectively
tuned to a subset of input patterns — thus, as a unit ends
up representing one set of patterns, this causes the unit
to become less likely to be activated for other ones.
For example, consider the case of the unit that se-
lectively represented the right diagonal line in the
above explorations. With the appropriate contrast en-
hancement parameters, learning for this unit caused its
weights to
decrease
for the left diagonal line even as
they increased for the right diagonal line. Thus, this
unit would have been much less likely to respond to
left diagonal lines, which would allow another unit to
“win” the competition for that case, resulting in good
representations of both types of lines.
row
0
1
2
3
4
3
2
1
0
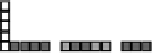
Figure 4.13:
Grid log view of all the weights for the hid-
den units after 30 epochs of learning. The larger-scale grid
represents the layout of the hidden units, with the smaller
grid within each of the larger grid elements showing the
weights from the input for the corresponding hidden unit. This
network has learned to represent the correlations present in
the individual lines, even though every input has two lines
present.
for a trained network — your grid log window will
eventually look like this one.). The larger-scale
5x4
grid is topographically arranged in the same layout as
the network. Within each of these 20 grid elements is
a smaller
5
x
5
grid representing the input units, show-
ing the weights for each unit. By clicking on the hidden
units in the network window, you should be able to ver-
ify this correspondence.
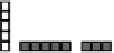
Now, let's see the environment the network will be
experiencing.
4.8.1
Exploration of Self-Organizing Learning
We will continue with the “lines” theme in this explo-
ration, by exposing a set of hidden units to an environ-
ment consisting of horizontal and vertical lines on a
5
x
5
input “retina.”
Open the project
self_org.proj.gz
in
chapter_4
to begin.
We f o c u s first on the network. The
5
x
5
input projects
to a hidden layer of 20 units, which are all fully con-
nected to the input with random initial weights.
Press
View
and select
EVENTS
in the control panel.
This will bring up a window showing 45 events repre-
senting different combinations of vertical and horizon-
tal lines. This is all unique pairwise combinations of
each type of line. Thus, there are no real correlations be-
tween the lines, with the only reliable correlations being
between the pixels that make up a particular line. To put
this another way, each line can be thought of as appear-
ing in a number of different randomly related contexts
(i.e., with other lines).
It should be clear that if we computed the correlations
between individual pixels across all of these images, ev-
erything would be equally (weakly) correlated with ev-
erything else.
,
!
,
!
As usual, select
r.wt
and view the weights for these
units.
Because viewing the pattern of weights over all the
hidden units will be of primary concern as the network
learns, we have a special grid log window that displays
the weights for all hidden units.
,
!
To see this, press
View
in the
self_org_ctrl
control panel, and select
WT_MAT_LOG
.
This will display all of the weights in the grid log
window that comes up (figure 4.13 shows this display
,
!
Thus, learning must be conditional on


Search WWH ::

Custom Search