Database Reference
In-Depth Information
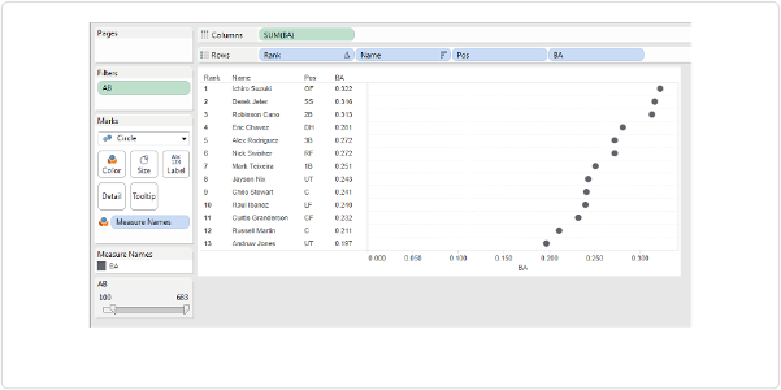
To tidy up the view, we can change the view to the dot chart discussed in
Chapter 3
and add
ure 5-5
.
This was a fairly straightforward example, as the proportions were already computed for us
and included as fields in the data set. After we learned how to filter out the players who
didn't have sufficient at bats, we were able to apply some of the same techniques to create
the final views.
Figure 5-5. Batting average dot chart
What happens when the proportions aren't neatly calculated for us, and when it's not a
simple matter of creating a ratio from two existing fields using a calculated field? For ex-
ample, what if we wanted to know what percentage of the team's overall home runs were hit
by each player?
Introducing Table Calculations
When I first started using Tableau, I didn't know much about table calculations. If I wanted
to find out what percentage of the overall team's home run count was hit by Robinson Cano,
for example, I'd either do the calculations myself outside of Tableau, or I'd struggle to make
my own calculated field in Tableau.