Database Reference
In-Depth Information
Introducing Filters and Quick Filters
One of the most powerful aspects of Tableau is that charts can be filtered using the same
drag-and-drop user interface that you've been learning over the past few chapters. If we want
to filter out all the players who have less than 100 at bats, for instance, we would only need
to drag the
AB
(for at bats) field into the Filters shelf above the Marks card, and then fill out
the resulting dialog box, as shown in
Figure 5-2
.
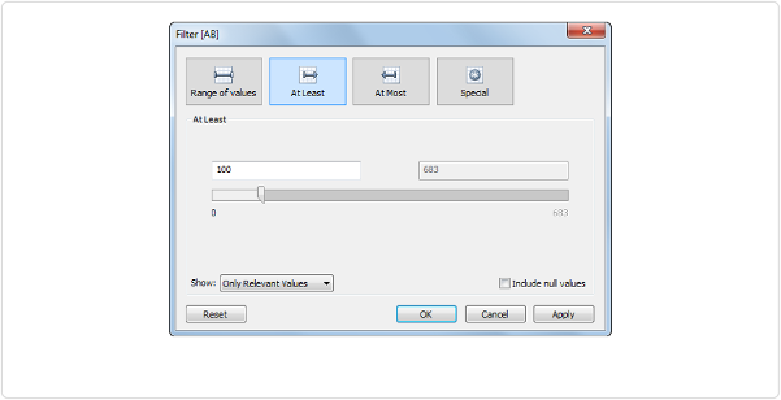
Figure 5-2. Filtering the BA bar chart to show only players with at least 100 at bats
We can drag the slider to the left or right, or enter a number into the text entry box to set the
minimum number of at bats, or we can filter a number of different ways using the tiles across
the top. We'll click
OK
with the setting shown in
Figure 5-2
, and the bar chart changes to the
view shown in
Figure 5-3
.
Notice the green
AB
pill in the Filters section in the top left. We'll consider other types of fil-
ters as we go along. One other important control to learn is the
Quick Filter
control. If we
hover over the green
AB
pill and click the small down arrow that appears within the pill, we
can select
Show Quick Filter
, and Tableau will place a slider control on the canvas for us. It
can be moved around, and I've moved it below the Marks card, as shown in
Figure 5-4
.