Database Reference
In-Depth Information
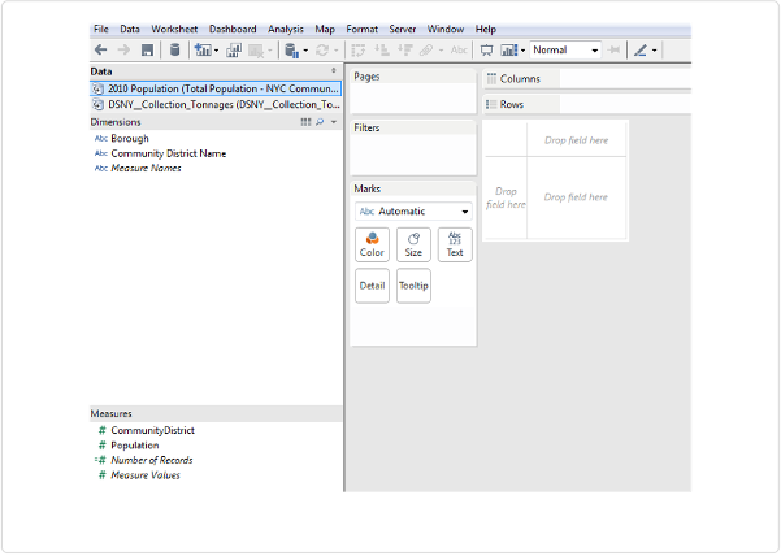
Figure 4-13. Adding a second data source to a workbook
The newly imported data set is highlighted in the Data area, and the fields for that data set
are shown in the Dimensions and Measures panels below. If we click on the DSNY data set,
the data fields for that data set will show below.
Notice that
CommunityDistrict
is in the Dimensions panel of the DSNY set, but it's in the
Measures area of the new population data source. Let's match them up by dragging
Com-
munityDistrict
from the Measures panel of the population table into the Dimensions area.
Because both data sources now have a Dimension called
Borough
and a Dimension called
CommunityDistrict
, Tableau will link them together for us. If the fields to link had different
names, we would have to manually link them using
Data
→
Edit Relationships
.