Database Reference
In-Depth Information
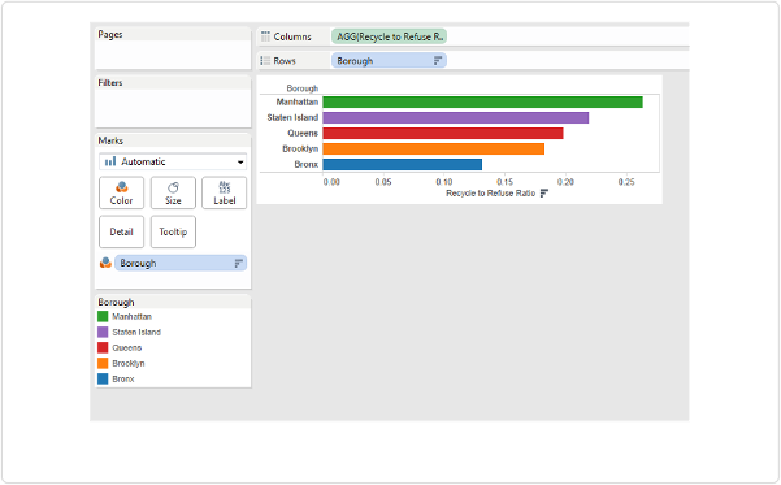
community district #1s will be aggregated, and all the community district #2s will be aggreg-
ated, and so on. Aggregating community districts in this way isn't very meaningful. Instead,
we'd like to see community district ratios for each borough.
Figure 4-3. Visualizing the ratio of recycle to refuse for each borough
To make this comparison, let's click and drag the
Borough
pill from the Rows shelf up to the
Columns shelf, and add the
CommunityDistrict
field from the Measures panel to the Rows
shelf to create a grid of bar charts, as shown in
Figure 4-4
.