Database Reference
In-Depth Information
they're things you
count
. While the visualization types are the same, the method to create
them in Tableau can be different.
A Tale of Two Formats
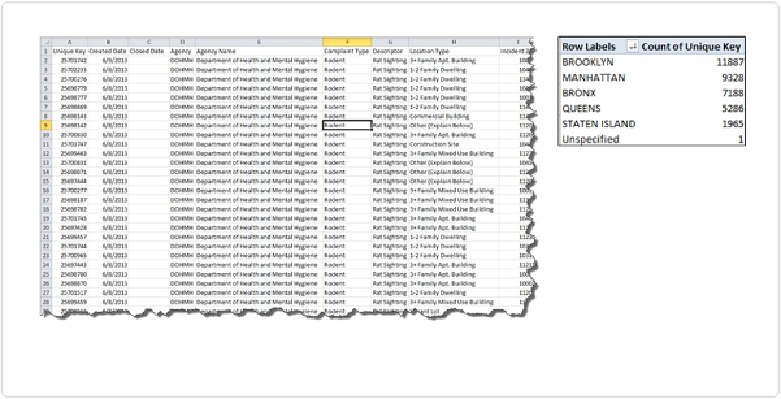
Let's consider an example of the same data structured two ways.
Figure 3-12
shows the raw
data for rat sightings as captured by the 311 call center in New York on the lefthand side, and
a pivot table of this data set by borough on the righthand side.
Figure 3-12. Data at the incident level and aggregate level
If your data is at the aggregate level (like the Excel pivot table on the righthand side of
Fig-
ure 3-12
), you will deal with it in Tableau similar to the garbage collection data. Tableau will
recognize
Count of Unique Key
(which you will probably rename something like
Rat
Sightings
) as a continuous Measure, exactly like
RefuseTonsCollected
in the previous
example.
But if your data looks like the raw data table on the left, which is far more common, how can
you communicate how many rat sightings were reported in each borough? There are two
ways:
Number of Records
and
Count
.