Database Reference
In-Depth Information
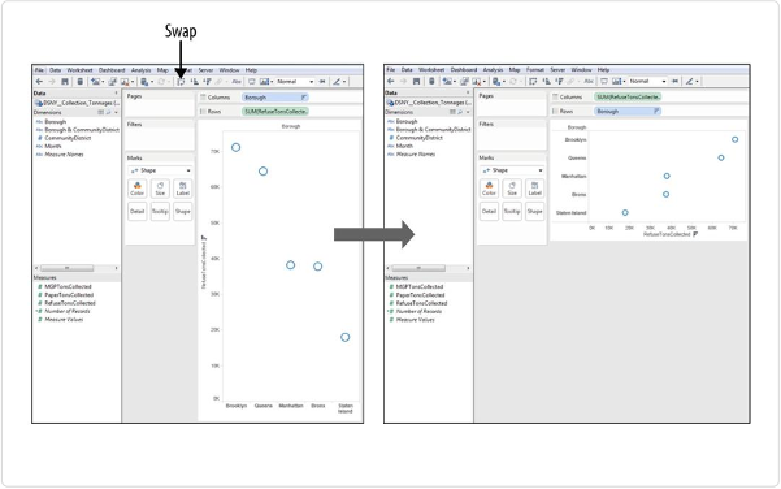
Figure 3-8. Using the Swap function to rotate view
To complete the dot chart, all we need to do is add horizontal lines extending across each
row. Typically, dot charts include on-center grid lines that pass through each dot. Adding grid
lines that pass between each dot involves using the built-in Format function, so we'll start
there.
To edit the format, right-click anywhere in the chart itself and select Format. Notice that the
lefthand panel changes from Dimensions and Measures to the Format panel, as shown in
Fig-
ure 3-9
.
To add grid lines between the dots, click the paintbrush icon, then click the Rows tab, and
choose a line type from the Grid Lines drop-down selector. Choosing the straight line yields
the chart shown in
Figure 3-10
.