Database Reference
In-Depth Information
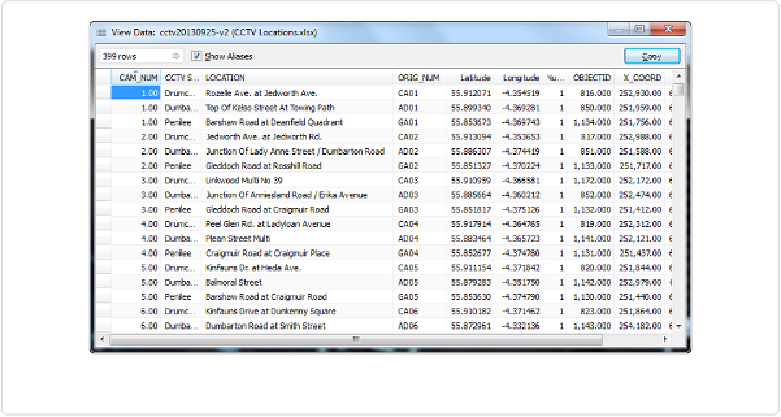
Figure 14-17. The underlying data for the Glasgow CCTV Dashboard
The first group of three steps shows you how to create a URL for each bridge, and the second
group of five steps shows you how to add a box to your dashboard to pull up the bridges.
Create the URLs
1. A particular latitude and longitude (say, 55.85608 and −4.25732) can be added to a
Tableau Dashboard using a URL like this:
https://maps.google.com/maps?q=55.85608,-4.25732&z=17&t=h&output=svembed
2. Breaking down the elements of the URL, we can see that after the latitude and longit-
ude, there are four distinct parameters in the URL:
q=55.85608,-4.25732
These are our coordinates for a single CCTV location. Note that if we have an ad-
dress field instead of Lat/Long, we can use a street address after “q=” as well.
&z=17
This specifies the zoom level. Higher numbers zoom in, lower numbers zoom out.