Database Reference
In-Depth Information
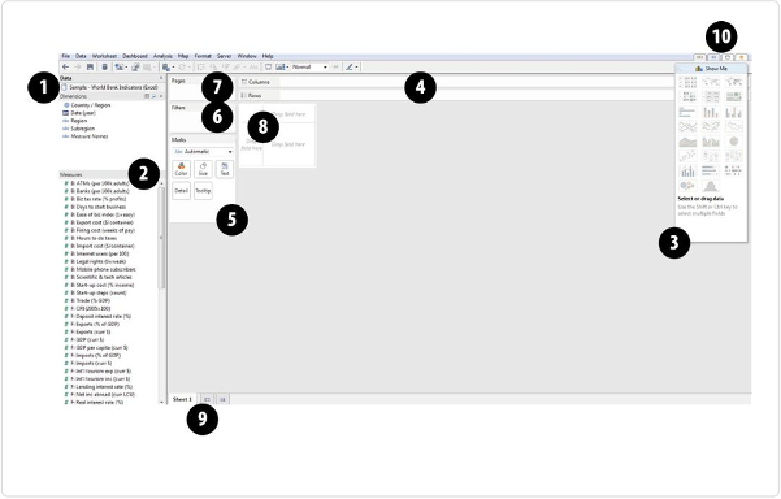
Figure 2-2. The Tableau user interface for a new Sheet
The following are the major components of the Sheet view, as indicated in the screen shot in
1. The list of data sources (can be more than one)
2. Dimensions and Measures: fields available to visualize in the selected data source
3. The “Show Me” card (shown opened): view applicable visualization types for selec-
ted fields
4. The Columns and Rows shelves: controls grouping headers (Dimensions) and axes
(Measures)
5. The Marks card: control visualization encoding of color, size, label text, tooltip text,
and shape
6. The Filters shelf: filters visualizations by Dimensions or Measures