Database Reference
In-Depth Information
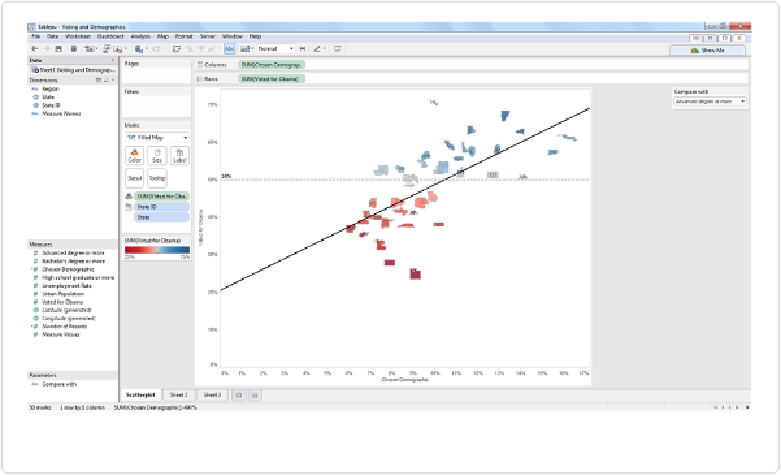
The resulting scatterplot (with grid lines removed) is shown in
Figure 11-22
. Notice that we
can use the Parameter control in the upper right to quickly change the x-axis variable to any
of the five fields we included in the Parameter.
Figure 11-22. Scatterplot of demographics and voting results
We can figure out which of the five variables is most closely correlated with the voting re-
cord by clicking on the trend line, right-clicking, and selecting
Describe Trend Model
. The
trend model when “Advanced degree or more” is selected is shown in
Figure 11-23
.