Database Reference
In-Depth Information
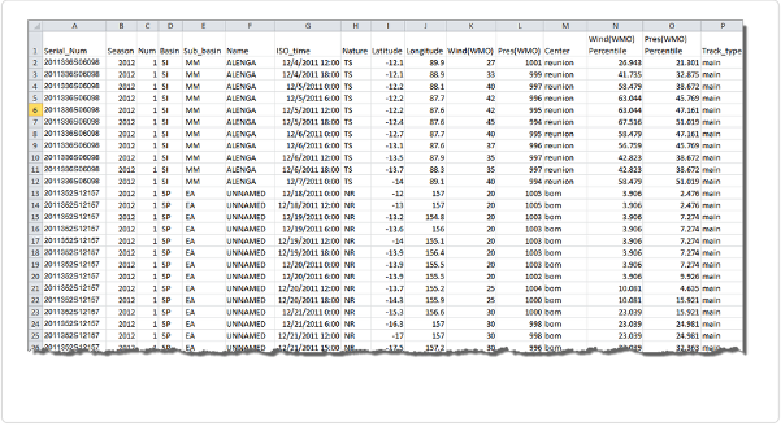
The table shown in
Figure 11-10
shows an Excel spreadsheet created from a
.csv
of 2012
hurricane data. Notice that each row contains a set of coordinates and information about a
particular storm at a particular hour. There are multiple rows for each storm, and the series of
coordinates contained in these rows provides a route that the storm followed over time.
Figure 11-10. NOAA hurricane data for 2012
If we connect Tableau to this data, and we drag
Latitude
to the Rows shelf,
Longitude
to
the Columns shelf,
Name
to the Label shelf, and
Basin
to the Color shelf, then we get the
circle map shown in
Figure 11-11
.