Database Reference
In-Depth Information
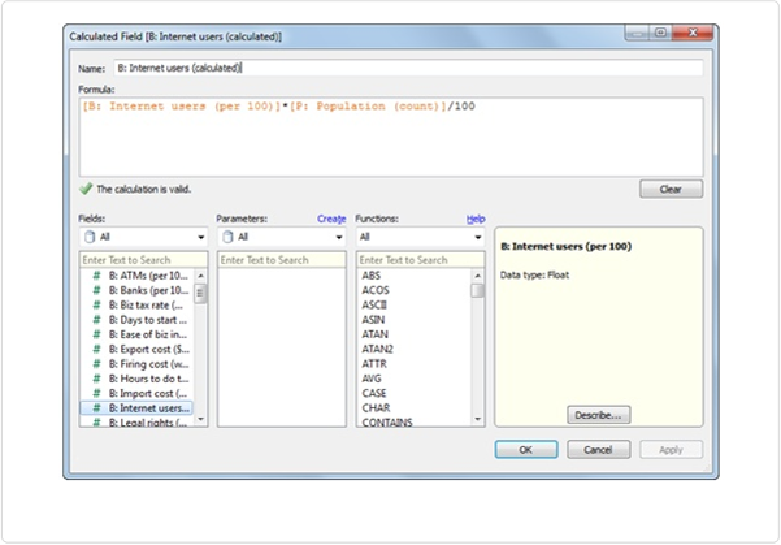
Figure 10-19. Creating a Calculated Field for the number of Internet users
We could create two different maps, one for each variable, or we could create a single map
that encodes both variables. Let's take a look at two ways to show both variables on a single
map: the first makes use of the dual-axis feature, and the second makes use of the two attrib-
utes of circles: size and color.
A Dual-Axis Map
Let's start with the filled map we created (shown in
Figure 10-14
). We'll take the following
steps to create a dual-axis map:
1. Drag another
Latitude (generated)
pill to the Rows shelf to the right of the first
one.
2. Click the small down arrow in the second
Latitude (generated)
pill and select
Du-
al Axis
(as shown in
Figure 10-20
).